Is Bittensor (TAO) Repeating Its History? Fractals Hint at Continuation of Bullish Rally

Date: Sun, May 04, 2025 | 11:26 AM GMT
After a rough start to 2025 — where even Ethereum (ETH) dropped 45% in Q1 — the crypto market is finally flashing signs of recovery. ETH has already bounced back more than 31% from its April 7 low, and that renewed strength is now spilling over into other major altcoins .
One of the standout performers is the AI-focused token Bittensor (TAO), which seems to be quietly setting up for another explosive move.
Following a deep correction in Q1, TAO has rebounded sharply — up 70% in the past 30 days — trimming its year-to-date losses to just around 20%. But this rebound might be more than just a temporary relief rally.
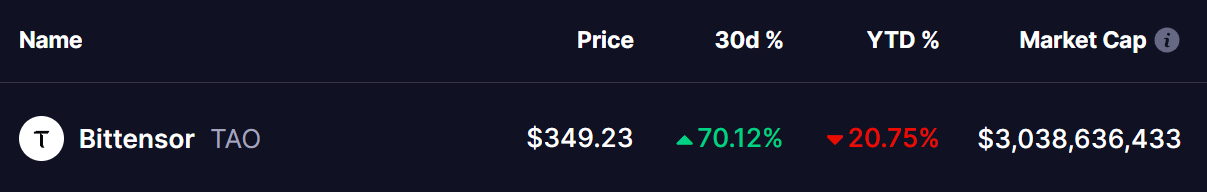 Source: Coinmarketcap
TAO Fractal Hints at a Familiar Pattern
When we look at the weekly chart, TAO appears to be repeating a very specific fractal pattern — one that has historically led to major rallies.
TAO has shown a tendency to bounce strongly off the $190 support zone, which has now acted as a key bottom three separate times. Each of the last two bounces from this area triggered massive moves of over 290% and 350%, respectively, pushing prices into the $740 resistance zone.
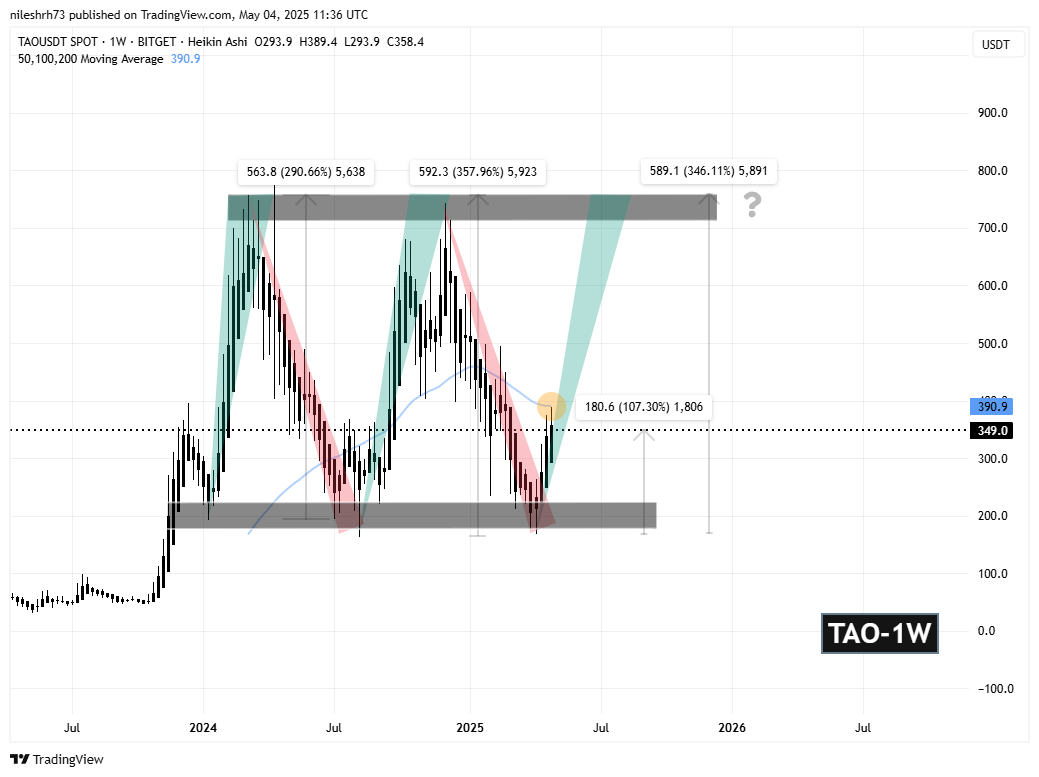 Bittensor (TAO) Weekly Chart/Coinsprobe (Source: Tradingview)
Third Time’s the Charm?
This current bounce is following a similar trajectory. After falling more than 76% from its highs, TAO hit the same $190 support zone in April and has since rallied to around $349 — up over 108%.
If history repeats and the fractal continues to play out, TAO could be headed toward another major rally.
But there’s one key level to watch: the 50-week moving average, which is currently hovering around $390 (highlighted by the yellow circle on the chart). A clear breakout above this level could confirm bullish momentum and pave the way for another run to the $740 resistance zone — which would mark a 346% gain from the recent bottom.
Disclaimer: This article is for informational purposes only and does not constitute financial advice. Always conduct your own research and consult with a financial advisor before making investment decisions.
Disclaimer: The content of this article solely reflects the author's opinion and does not represent the platform in any capacity. This article is not intended to serve as a reference for making investment decisions.
You may also like
Will Kaspa (KAS) Bounce to Continue Its Rebound? This Fractal Says Yes!

Will Injective (INJ) Bounce Back to Extend Its Rebound? This Fractal Pattern Says Yes!

Can Cardano (ADA) Bounce to Continue Its Rebound? This Pattern Says Yes!

ONDO Price Consolidates Below $1.00: Here’s Why $1.03 Is the Key for Breakout