Will Kaspa (KAS) Bounce to Continue Its Rebound? This Fractal Says Yes!

Date: Sun, May 04, 2025 | 06:56 AM GMT
After a rough start to 2025—where even Ethereum (ETH) slumped by 45% in Q1—the crypto market is finally showing signs of life. ETH has bounced back by over 32% from its April 7th low, and this bullish energy is spilling over into major tokens as well.
However, among altcoins today, Kaspa (KAS), after making a strong rebound of 42% in the last 30 days, is trading slightly in the red, down by over 5%. Despite this temporary pullback, a promising fractal pattern might just clear the fog about Kaspa’s potential next move.
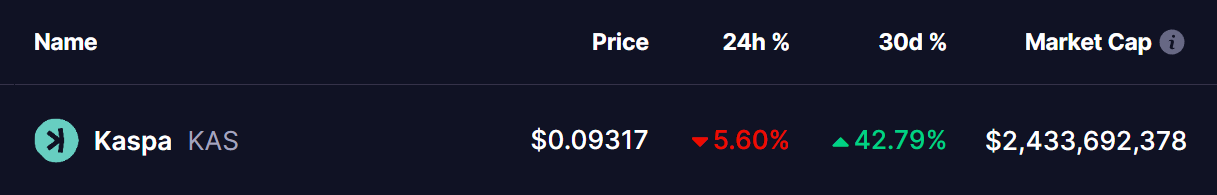 Source: Coinmarketcap
Kaspa (KAS) Mirrors Past Breakout Setup
A closer look at the KAS 1-day chart reveals something interesting. On the left side of the chart, which shows the June–July 2023 setup, KAS was stuck in a prolonged downtrend marked by a clear descending trendline. After weeks of grinding lower, it finally stabilized within a grey accumulation zone.
What followed was a breakout above both the 50-day and 100-day moving averages—signals that confirmed a shift in momentum. The breakout was followed by a small pullback (highlighted in red), before KAS took off in a steep rally, gaining more than 150% with in a month.
Fast forward to the present, and the pattern is eerily similar. The right side of the chart shows the current 2025 price action: another steep downtrend, another grey accumulation base, and another breakout above the 50-day and 100-day moving averages.
Just like before, the breakout was followed by a red zone pullback where the price is currently trading at $0.092, suggesting that history could be repeating itself—if it makes a bounce.
What’s Ahead?
If KAS continues to follow this fractal structure, the price could be on track to hit the $0.17 to $0.19 range in the coming weeks marked in green projection lines—a move that would represent a further 90% gain from the current level.
That said, caution is warranted. If the price fails to hold support of 100-day MA and the level of $0.08292, it could be the first early warning sign that this bullish setup is starting to weaken. A break below that level might invalidate the fractal pattern and suggest that more consolidation is needed before any real upside can resume.
For now, Kaspa traders and fractal watchers alike will be paying close attention. History might not repeat exactly—but it often rhymes.
Disclaimer: This article is for informational purposes only and not financial advice. Always conduct your own research before investing in cryptocurrencies.
Disclaimer: The content of this article solely reflects the author's opinion and does not represent the platform in any capacity. This article is not intended to serve as a reference for making investment decisions.
You may also like
Is Bittensor (TAO) Repeating Its History? Fractals Hint at Continuation of Bullish Rally

Will Injective (INJ) Bounce Back to Extend Its Rebound? This Fractal Pattern Says Yes!

Can Cardano (ADA) Bounce to Continue Its Rebound? This Pattern Says Yes!

ONDO Price Consolidates Below $1.00: Here’s Why $1.03 Is the Key for Breakout