Is Sei (SEI) Gearing Up for a Bullish Reversal? This Fractal Says Yes!

Date: Thu, April 17, 2025 | 05:27 PM GMT
The cryptocurrency market has endured a brutal start to the year, with Ethereum (ETH) logging a staggering 45% drop in Q1 — its worst quarterly performance in years. This widespread downturn rippled across the entire altcoin sector. However, investor sentiment is beginning to shift following U.S. President Trump’s recent announcement of a 90-day tariff pause, a move that injected fresh optimism into the market.
One token that appears to be taking advantage of this shift is Sei (SEI). After suffering a steep decline of 59% in last 90 days, the Layer 1-focused token has rebounded sharply, registering 15% gains over the past week.
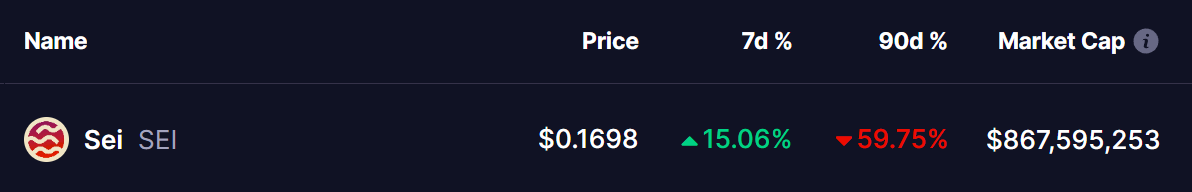 Source: Coinmarketcap
But beyond the bounce, what’s really catching the attention of traders is a striking similarity between SEI’s current price structure and Polygon (MATIC)’s setup just before its massive bull run in late 2020.
SEI Chart Resembles MATIC’s Past Price Behavior
According to the latest fractal comparison chart shared by @BullSignal_ , there are some eye-catching similarities between SEI’s current price action and MATIC’s historic move.
After an impressive 260% rally between August and December, SEI topped out near $0.7357 (marked by the red arrow) — a peak that eerily mirrors MATIC’s old structure. Following this, SEI suffered a brutal 80%+ correction, eventually finding support around $0.14, just slightly below the support line of its falling wedge pattern — exactly what MATIC experienced when it corrected by 64% before its explosion.
Now, SEI has bounced back to $0.1776 and is tightening up near the wedge resistance. If history repeats itself, a breakout could occur — just like MATIC did in 2020, which then skyrocketed 16,000% from $0.016 to a staggering $2.72 over the next year.
For SEI, if it follows the same fractal, a breakout from this wedge could initiate a rally back toward its previous local high of $0.73 — a massive 327% upside from the current levels.
Is a Bullish Reversal Ahead?
While nothing is guaranteed in crypto, the fractal comparison is certainly giving bullish traders a reason to watch SEI closely. The confluence of technical support, a strong rebound, and historical pattern similarity with MATIC is painting a very promising picture.
Of course, broader market conditions, Bitcoin’s stability, and SEI’s own ecosystem developments will play critical roles in determining whether the breakout truly materializes.
Disclaimer: This article is for informational purposes only and not financial advice. Always conduct your own research before investing in cryptocurrencies.
Disclaimer: The content of this article solely reflects the author's opinion and does not represent the platform in any capacity. This article is not intended to serve as a reference for making investment decisions.
You may also like
Trump says US economy faces transition with 60% recession risk

Bitcoin Reaches $97K Amidst Sluggish Network Activity: Time for Investor Alarm?
Unpacking the Paradox: Skyrocketing Bitcoin Values Amidst Noticeable Downturn in Network Activity

XRP price risks 45% decline to $1.20 — Here is why
Ethereum Analyst Foresees 2025 Breakout Despite Market Trends