After consolidating for most of April, the XRP price today remains in a pivotal zone near $2.17, caught between key moving averages and descending resistance lines. While the broader trend remains range-bound, recent rejections and failed breakouts raise fresh concerns for short-term bulls. Traders are closely watching whether the XRP price can reclaim $2.20 or if a bearish retest toward $2.00 looms ahead.
Multi-Timeframe Structure: What’s Happening With XRP’s Price?
 XRP/USD price dynamics (Source: TradingView.)
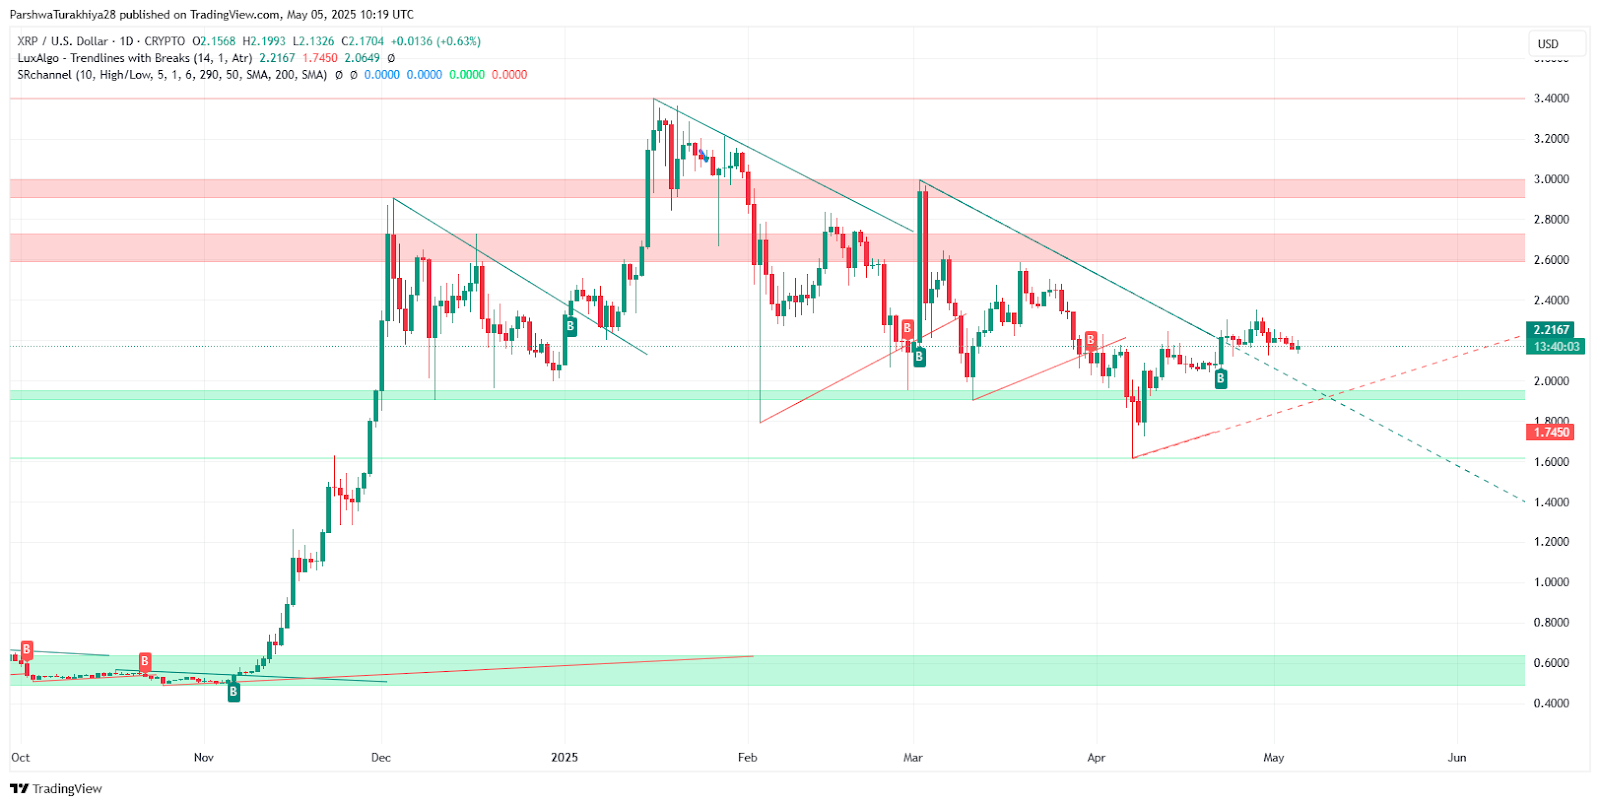
The daily chart shows XRP trading within a compressing triangle that has defined April’s price action. The descending trendline from the March high continues to cap upside moves, currently intersecting around $2.26. Horizontal support in the $2.05–$2.10 region remains structurally critical and has held firm across both March and April pullbacks.
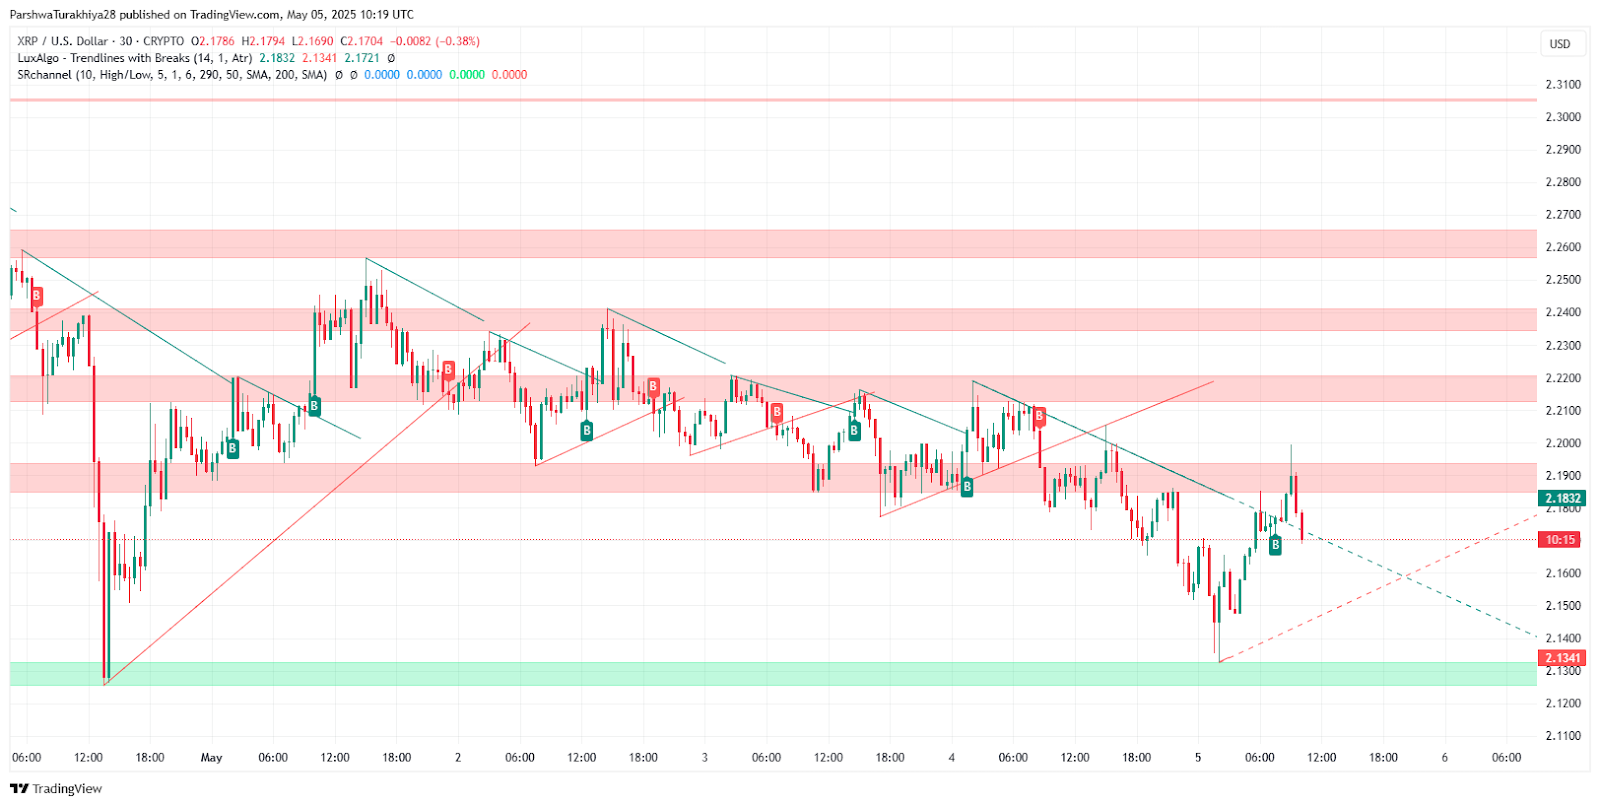
The 30-minute and 4H charts highlight failed attempts to break above the $2.20–$2.23 resistance zone, with multiple lower highs forming. The coin is currently hovering just below both short-term trendline resistance and a previous breakdown zone.
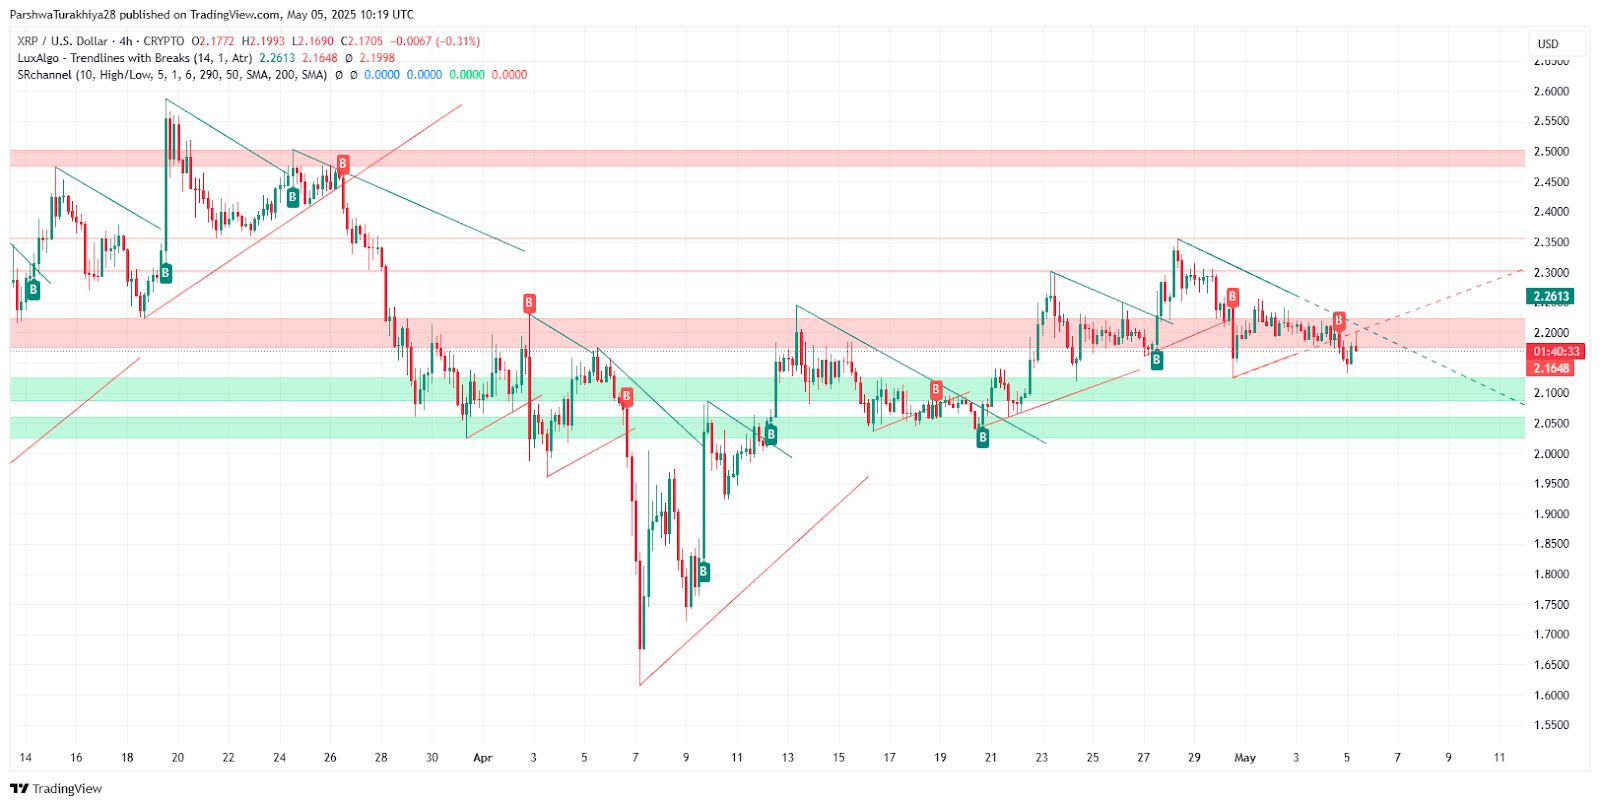
XRP Price Action: Structure Across Daily and 4H Charts
 XRP/USD price dynamics (Source: TradingView.)
The XRP price action remains confined between the larger descending resistance (now at $2.26) and support zones between $2.05–$2.10. The daily chart shows a retest of this confluence zone after a clean rejection from the upper range last week. This range has previously served as a springboard for rallies in March and April.
The 4H chart displays multiple lower-high breakdowns with bearish flag structures, each facing rejection near $2.25. Support clusters are visible near $2.10–$2.00 and remain crucial to prevent further downside risk in May.
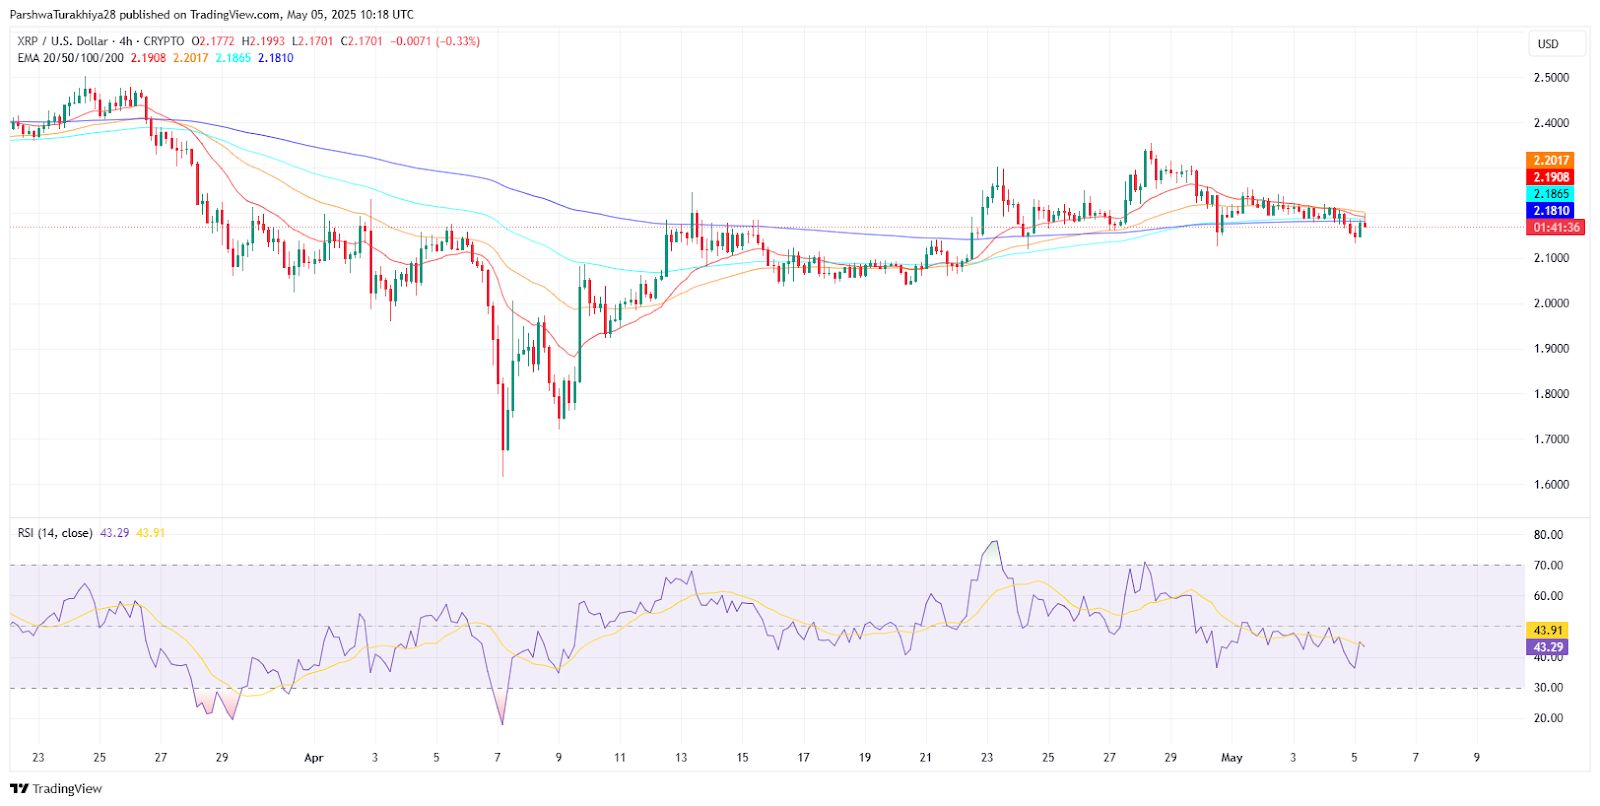
XRP Price Update: EMA and RSI Signal Neutral to Bearish Lean
 XRP/USD price dynamics (Source: TradingView.)
Short-term EMAs on the 4H chart are converging, with:
- 50 EMA at $2.186
- 100 EMA at $2.181
- 200 EMA at $2.19
Price has fallen below all key EMAs, with the 200 EMA now acting as a ceiling. Meanwhile, RSI sits at 43.29, indicating a neutral to slightly bearish momentum. A failure to reclaim the EMA-50 quickly could keep the XRP price action pinned below key thresholds, while a rebound above $2.19 could suggest a shift in sentiment.
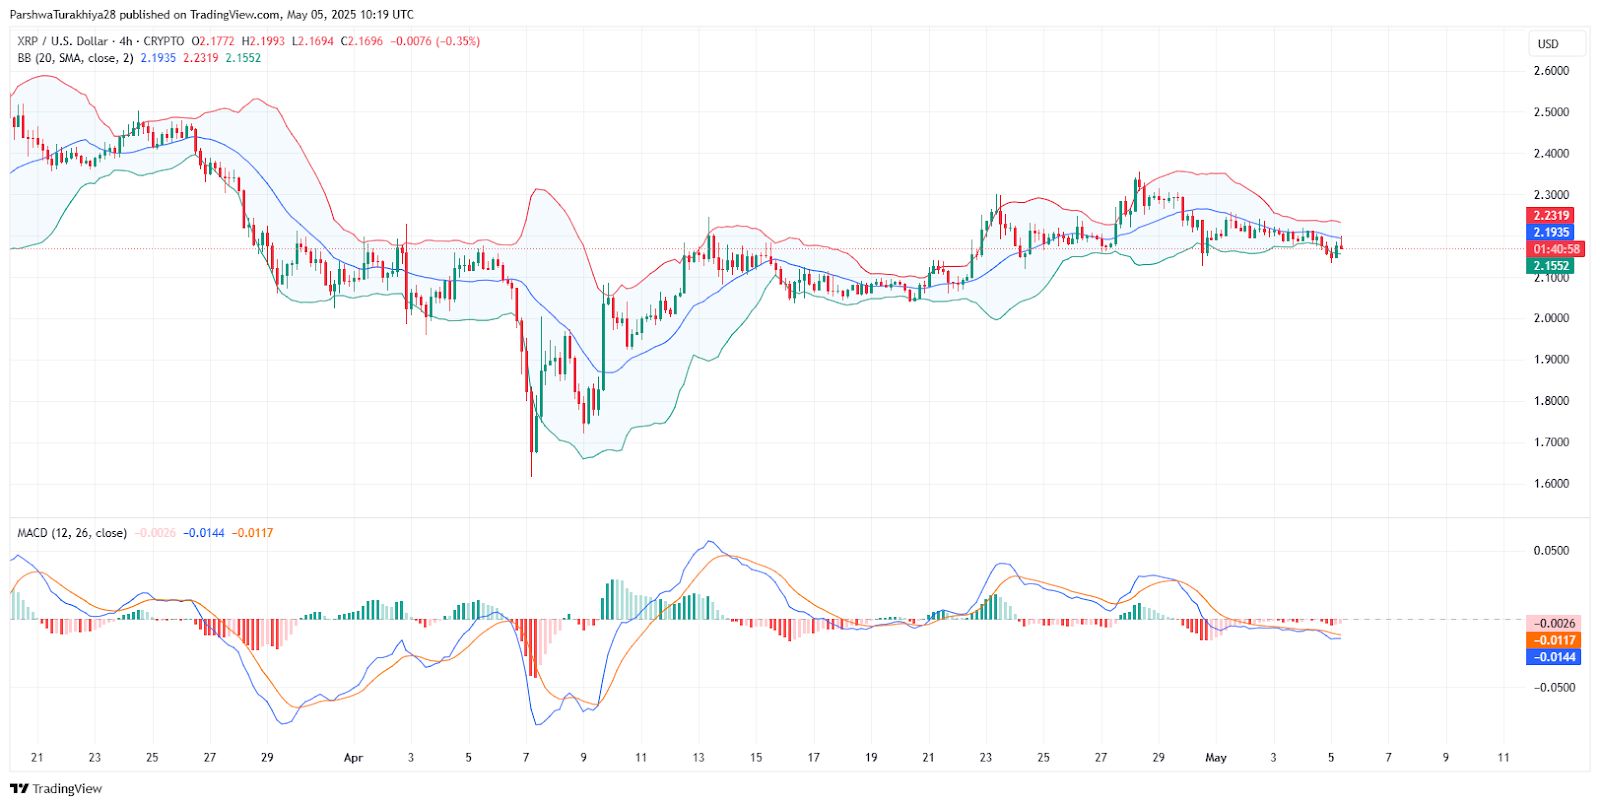
Bollinger Bands and MACD: Compressed Ranges Signal Pending Move
 XRP/USD price dynamics (Source: TradingView.)
XRP price volatility has compressed significantly since April-end. Bollinger Bands on the 4H chart are tight, with price hugging the lower band at $2.15. The upper band caps resistance at $2.23.
MACD momentum is weakening further below the zero line, with both the MACD line (-0.0117) and signal line (-0.0144) pointing down. This confirms the ongoing bearish momentum, though the histogram is flattening — indicating a possible slowdown in selling pressure.
XRP Price Forecast: Key Levels to Watch in May 2025
 XRP/USD price dynamics (Source: TradingView.)
Zooming out to the daily and 4H trendlines, XRP is approaching the apex of a converging triangle. The upper resistance line sits near $2.26–$2.30, while the lower channel support converges around $2.10. April saw multiple attempts to break above these levels, but all failed to gain follow-through.
The broader XRP price update indicates that the market is waiting for a volatility trigger—a decisive breakout or breakdown could dictate the direction for the rest of May. So far, no candle has closed above the major resistance zone, and volume remains tepid.
Price remains in a broad descending wedge visible on both 4H and daily charts. A breakout above $2.26 could open a move to $2.45–$2.60, but failure to reclaim the trendline risks further losses below $2.00.
| Scenario | Key Zone | Probability | Commentary |
| Bullish breakout | $2.26–$2.45 | Low–Moderate | Needs strong volume and daily close above descending resistance |
| Consolidation | $2.05–$2.26 | High | Market remains indecisive with EMAs flattening and RSI under 50 |
| Bearish pullback | $1.88–$2.00 | Moderate | Breakdown below $2.05 support could send XRP retesting April lows |
Why XRP Price Going Down Today?
The recent dip in XRP price today is largely due to technical rejection from the $2.26 resistance, coupled with weak bullish momentum. MACD and RSI fail to confirm a breakout, while daily structure remains under pressure from a multi-month descending trendline.
Disclaimer: The information presented in this article is for informational and educational purposes only. The article does not constitute financial advice or advice of any kind. Coin Edition is not responsible for any losses incurred as a result of the utilization of content, products, or services mentioned. Readers are advised to exercise caution before taking any action related to the company.