AKT Rallies Rallies Through Key Resistance – Can Arweave (AR) Catch Up Following the Same Fractal?

Date: Thu, May 01, 2025 | 12:36 PM GMT
In the cryptocurrency market over the past month, major tokens are beginning to show signs of recovery after suffering heavy corrections in Q1. Among the top performers, Akash Network (AKT) has gained attention with a strong 47% rally, triggered by clear technical breakouts on the daily chart.
Meanwhile, Arweave (AR)—which experienced a similar steep correction—is now showing signs of life. The token has moved up 8% over the past 30 days, and technical indicators suggest it might be preparing for a stronger rally, potentially echoing AKT’s recent move.
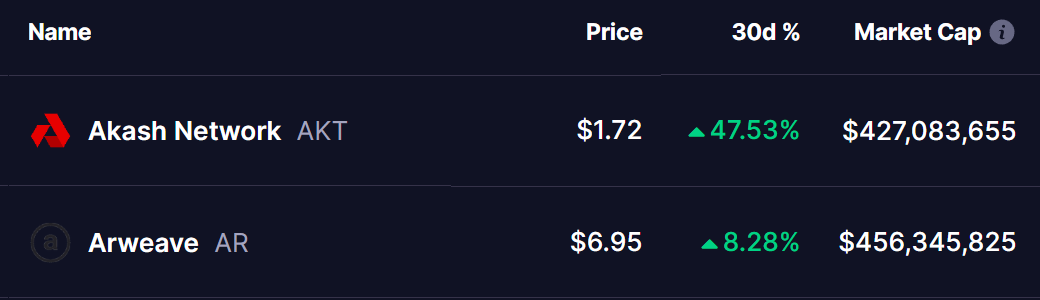 Source: Coinmarketcap
AKT and AR Fractal Analysis
As illustrated in the chart, AKT (left side) experienced a deep 55% correction earlier this year. After bottoming out around $0.85 on April 7, the token reversed sharply, flipping the 50-day and 100-day moving averages (MAs) into support levels. This upward momentum has taken AKT to $1.70, marking a 51% rally from the lows.
Price is now testing resistance near $1.75, marked in green. A clean break above this level could pave the way for a move toward the upper resistance zone between $1.90 and $1.95, highlighted in blue.
On the right side, Arweave (AR) seems to be mirroring the same structure. AR also dropped about 55%, reaching a low of $4.63 on April 7. Since then, it has cleared the 50-day MA and is now trading at $6.94, just beneath the 100-day MA around $8.11—a critical resistance level.
If AR follows AKT’s lead and breaks above the 100-day MA, it could potentially target the next major resistance zone around $8.99, representing a 49% move from its breakout point.
What’s Ahead?
If Arweave (AR) can decisively break and hold above the 100-day MA, it may confirm the ongoing fractal and spark renewed buying interest—just as we saw with AKT. Momentum could carry it into the next resistance region, completing the pattern.
However, traders should watch closely for potential rejection zones. Failure to break key resistance may lead to a period of sideways consolidation or even another pullback.
Still, with both AKT and AR showing near-identical patterns—same depth of correction, same recovery structure, and similar moving average flips—AR may be the next token to break out, provided market conditions remain supportive.
Disclaimer: This article is for informational purposes only and does not constitute financial advice. Always conduct your own research and consult with a professional before making investment decisions.
Disclaimer: The content of this article solely reflects the author's opinion and does not represent the platform in any capacity. This article is not intended to serve as a reference for making investment decisions.
You may also like
Antalpha Seeks Nasdaq Listing with IPO Launch

UK and India Conclude Free Trade Agreement

US Senate Advances Bowman’s Fed Vice Chair Nomination
SOL Strategies Acquires Over 122,500 Solana Tokens