KuCoin (KCS) Shrugs Off Market Weakness, Eyes 58-Day Price High

KCS, KuCoin's native token, has posted a modest price increase despite market weakness, with technical indicators suggesting growing bullish momentum.
KCS, the native token of cryptocurrency exchange KuCoin, is holding strong amidst a market-wide downturn. The altcoin has defied the broader market downturn with a 1% price increase in the past 24 hours.
This modest uptick may signal the beginning of a larger bullish trend, as technical indicators show strengthening upward momentum. This analysis holds the details.
Buying Pressure Intensifies for KCS
Readings from KCS’ daily chart suggest that bullish pressure is building. Notably, its Relative Strength Index (RSI) is currently at 58.32 and is on an upward trend, confirming the strengthening demand for the altcoin.
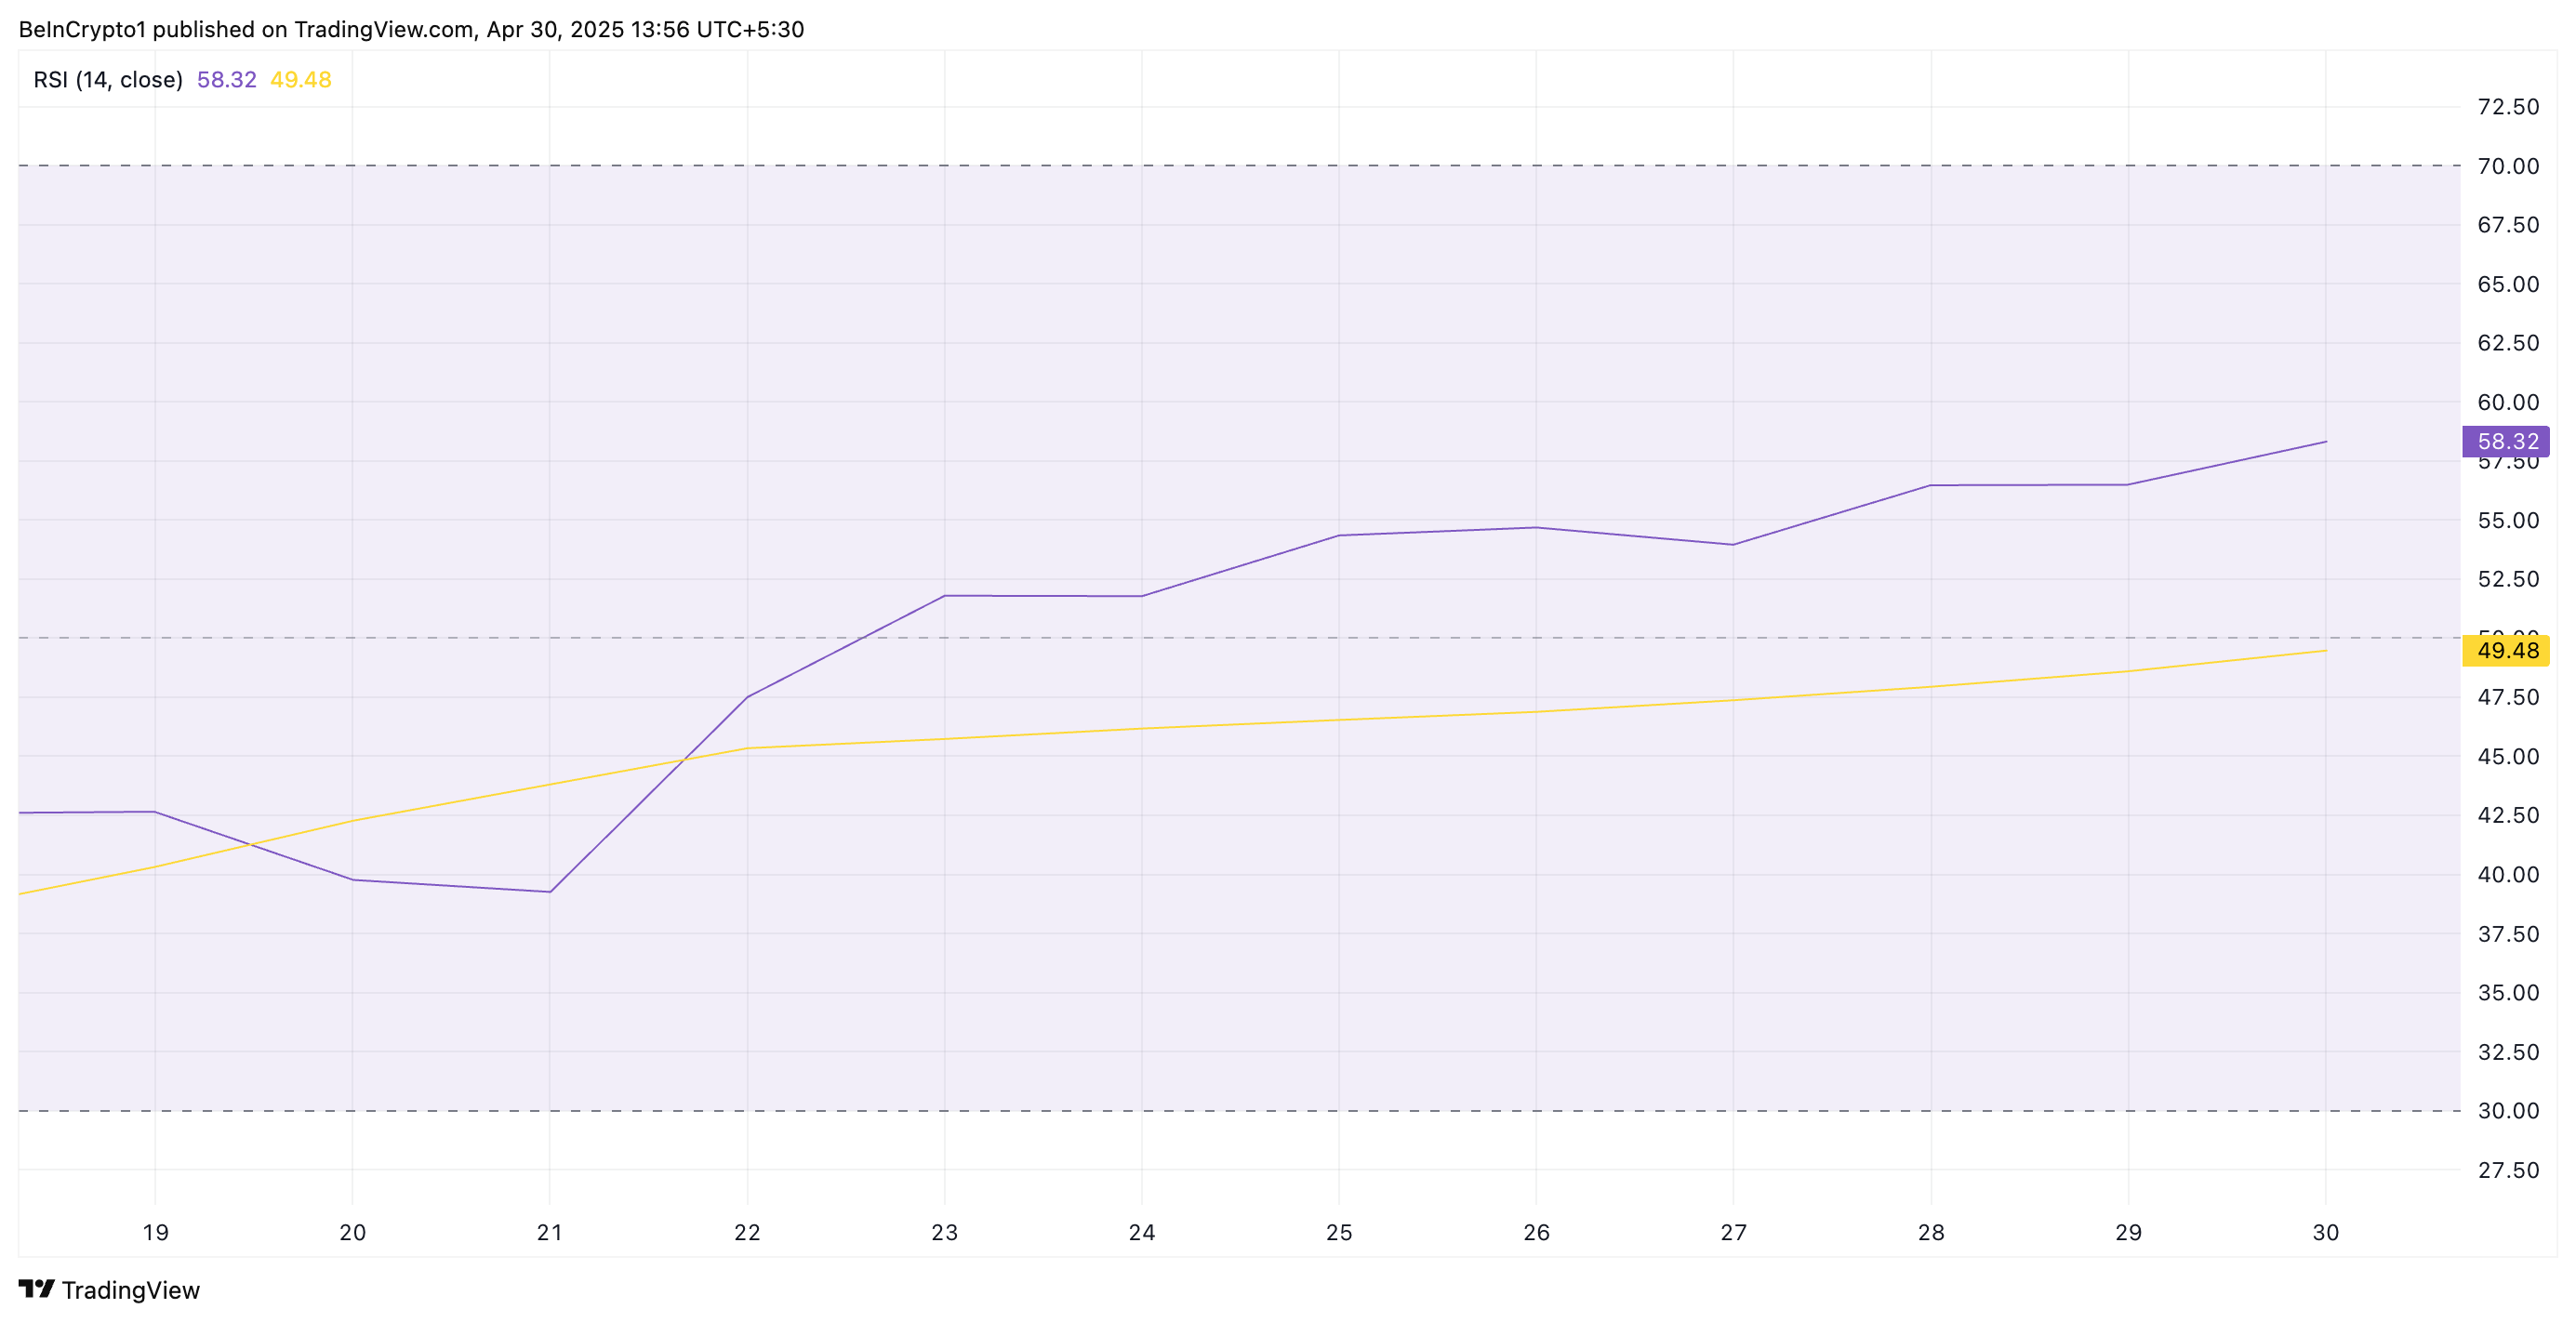 KCS RSI. Source:
TradingView
KCS RSI. Source:
TradingView
The RSI indicator measures an asset’s overbought and oversold market conditions. It ranges between 0 and 100, with values above 70 suggesting that the asset is overbought and due for a price decline. Converesly, values under 30 indicate that the asset is oversold and may witness a rebound.
At 58.32 and climbing, KCS RSI signals that bullish momentum is gaining traction and buying pressure is intensifying.
Moreover, the token’s Moving Average Convergence Divergence (MACD) confirms this positive trend. As of this writing, KCS’ MACD line (blue) rests above its signal line (orange).
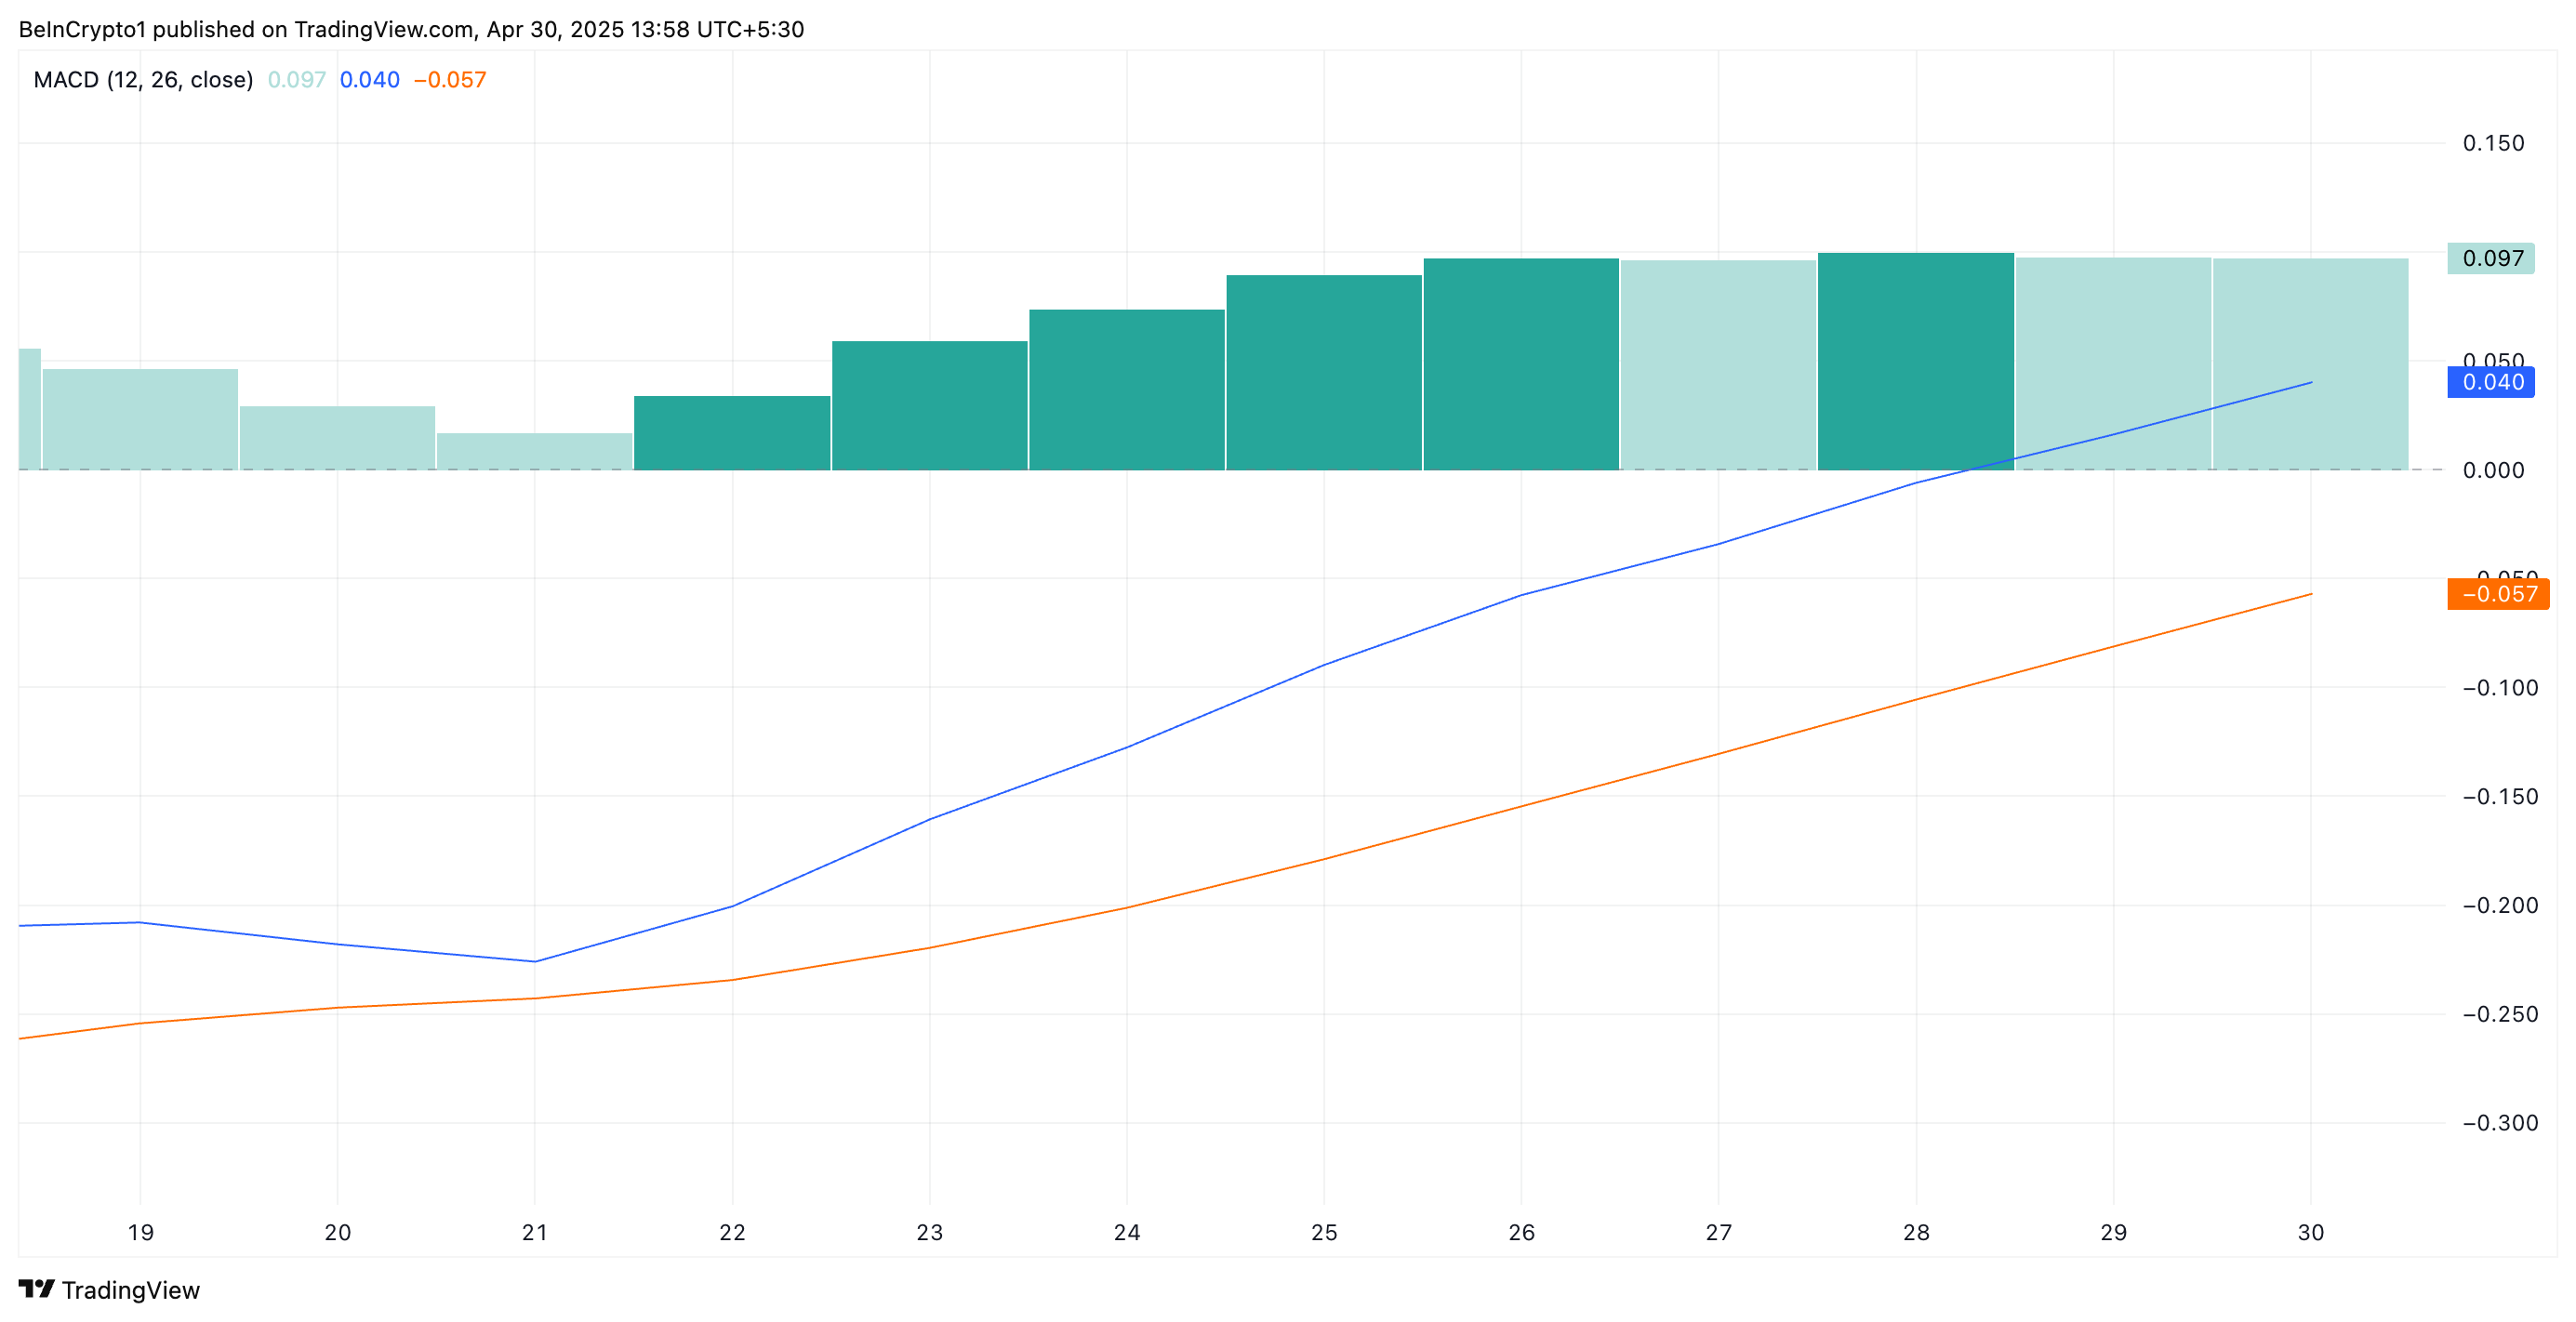 KCS MACD. Source:
TradingView
KCS MACD. Source:
TradingView
An asset’s MACD indicator identifies trends and momentum in its price movement. It helps traders spot potential buy or sell signals through crossovers between the MACD and signal lines.
As in KCS’ case, when the MACD line is above the signal line, it indicates bullish momentum in the market. Also, traders often view this setup as a buy signal; hence, they might be prompted to buy more KCS tokens, further driving up its short-term value.
KCS Tests Critical Level as Bulls Aim for 58-Day High
KCS currently trades at $10.71, resting just below the resistance formed at $10.90. If the demand for the altcoin grows and it successfully flips this price barrier into a support floor, it could propel KCS to $11.77, a high last reached on March 3.
However, if KCS holders resume profit-taking, it could lose its recent gains and fall to $10.027.
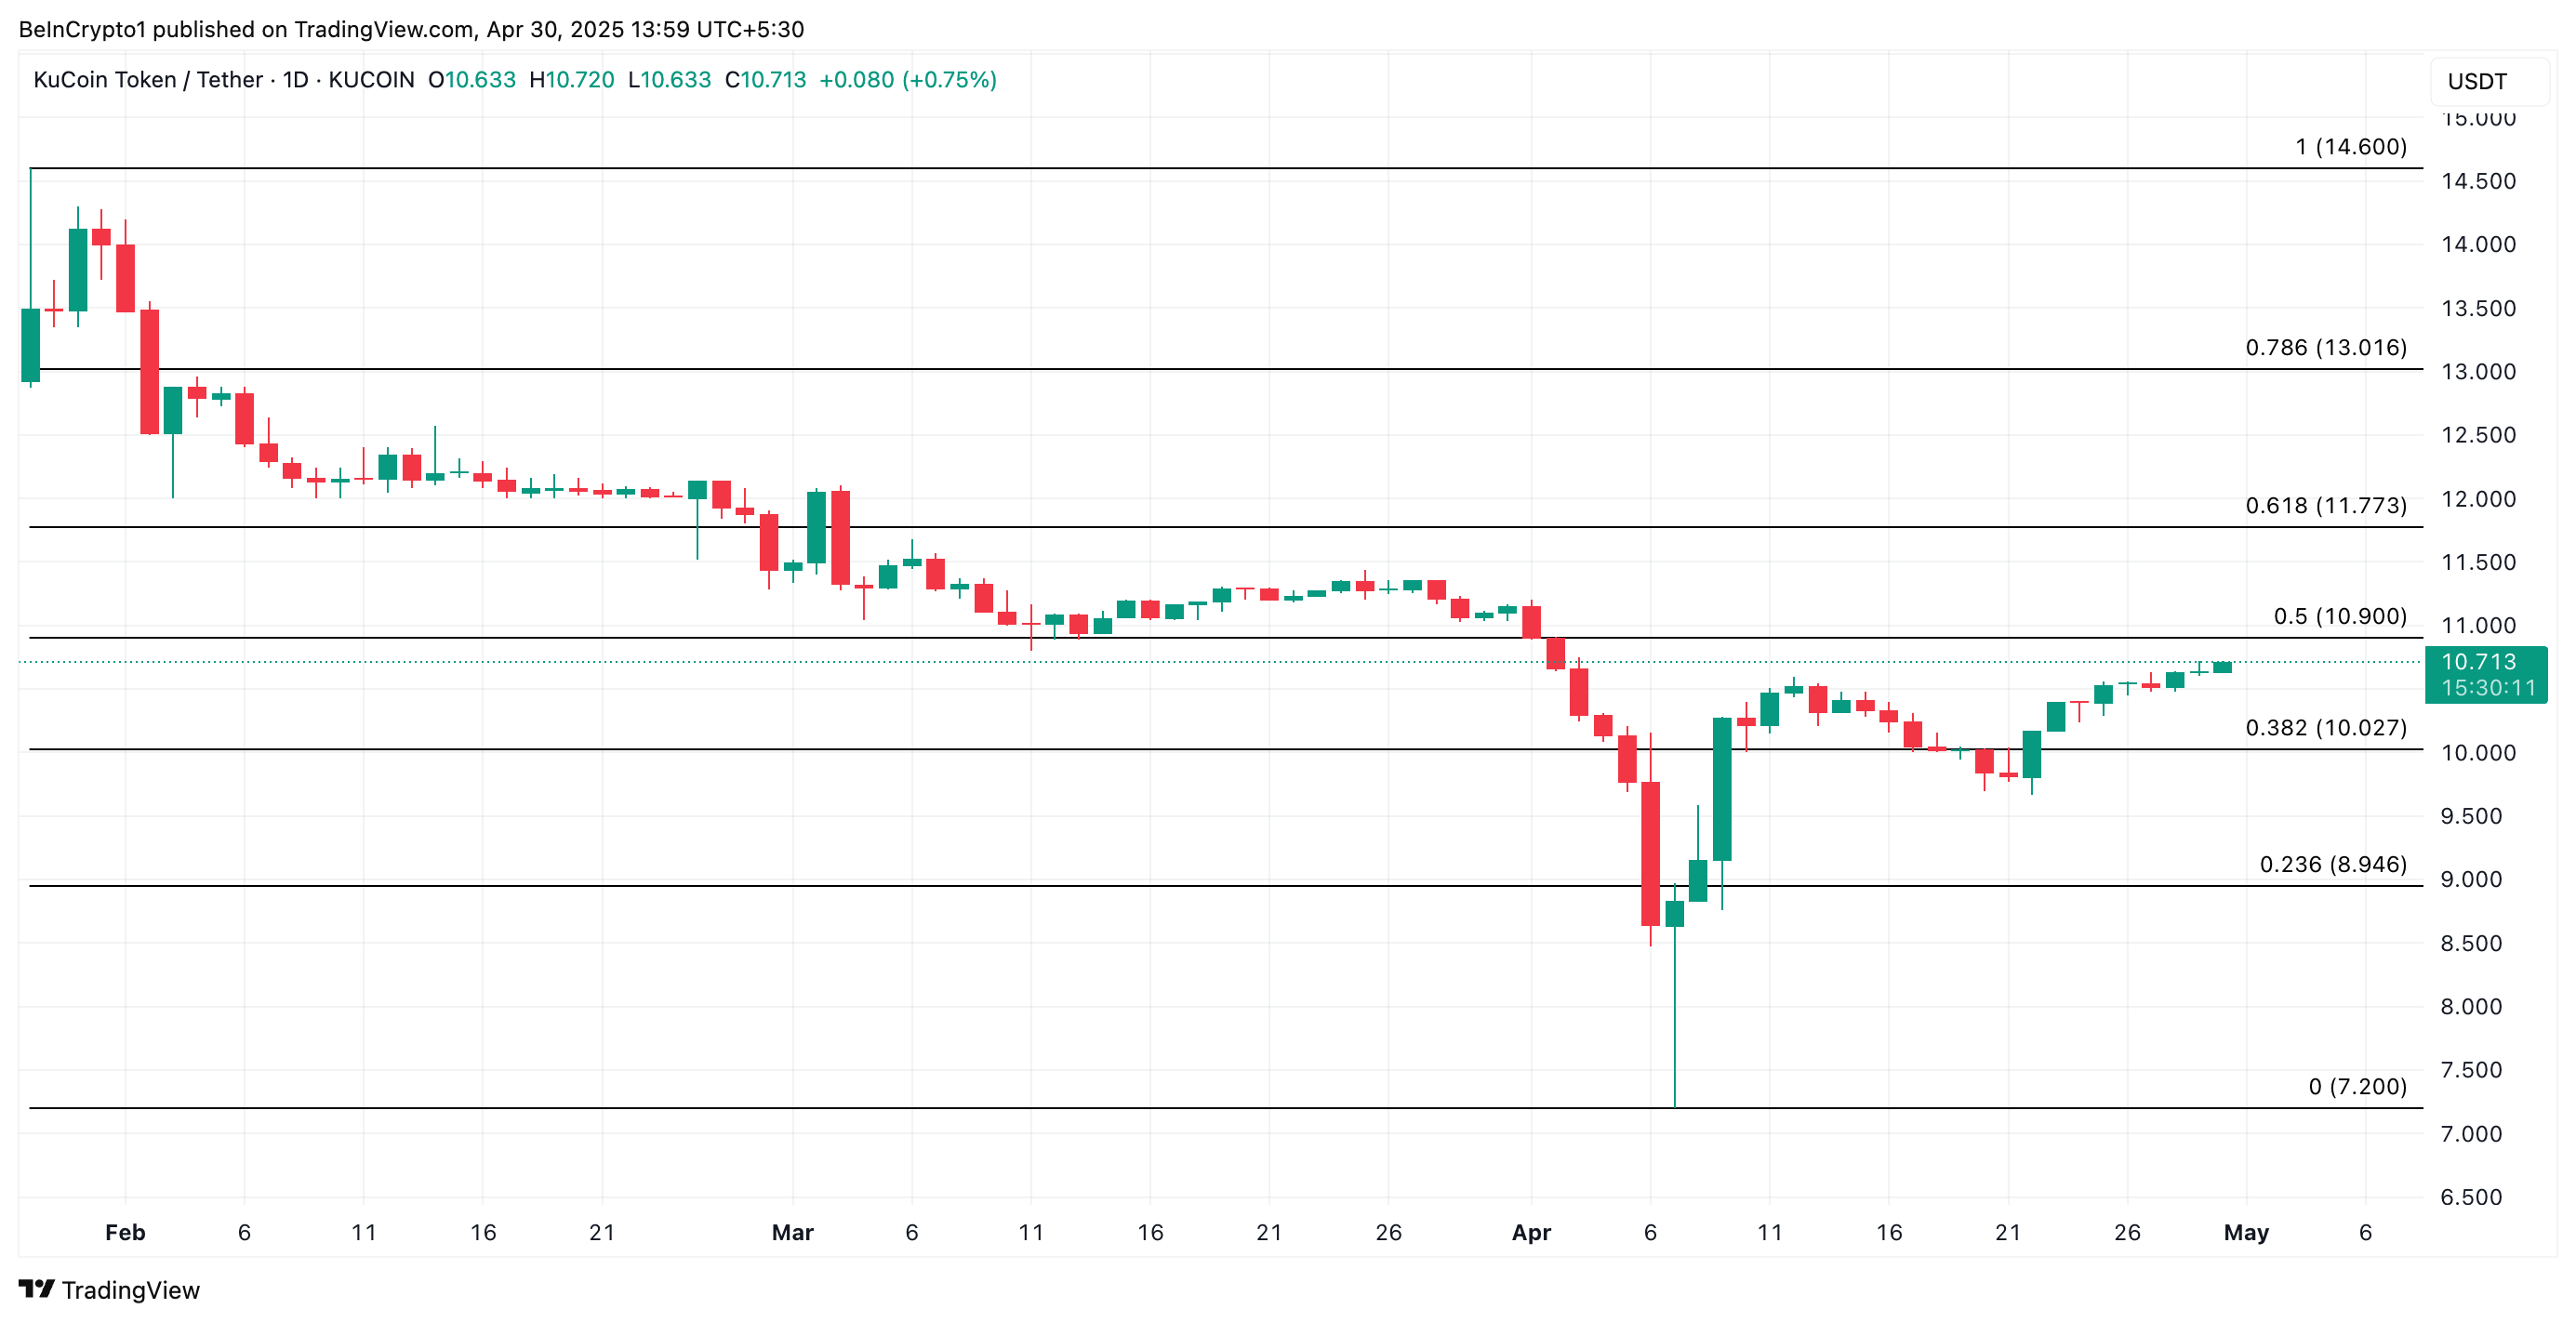 KCS Price Analysis. Source:
TradingView
KCS Price Analysis. Source:
TradingView
If the bulls fail to defend this support level, KCS could extend its decline, break below $10 to trade at $8.94.
Disclaimer: The content of this article solely reflects the author's opinion and does not represent the platform in any capacity. This article is not intended to serve as a reference for making investment decisions.
You may also like
Official 'Black Mirror' Token Turns Social Credit Into Crypto Game
Bitcoin Price Prediction: BTC Eyes $145,000 Rally as Michael Saylor Launches Another $21B Plan
Treasury Committee Eyes Stablecoin Boom Fueling US Bond Demand
Two Prime Abandons Ethereum For Bitcoin, Tags ETH As A Memecoin