Pi Network (PI) Inches Up 7%, Yet Bulls Struggle to Take Control

PI’s price has climbed 7% over the last seven days, signaling modest upward momentum. It currently trades at $0.65.
However, technical readings reveal that the rally largely lacks conviction from bullish traders, suggesting the price growth is more reflective of overall market growth than demand for PI.
PI Climbs, But Momentum Stalls
A key indicator supporting this outlook is the Relative Strength Index (RSI), which has remained largely flat despite the price uptick. This indicates a balance between PI’s buying and selling pressure, rather than a surge in bullish sentiment that typically accompanies sustainable rallies.
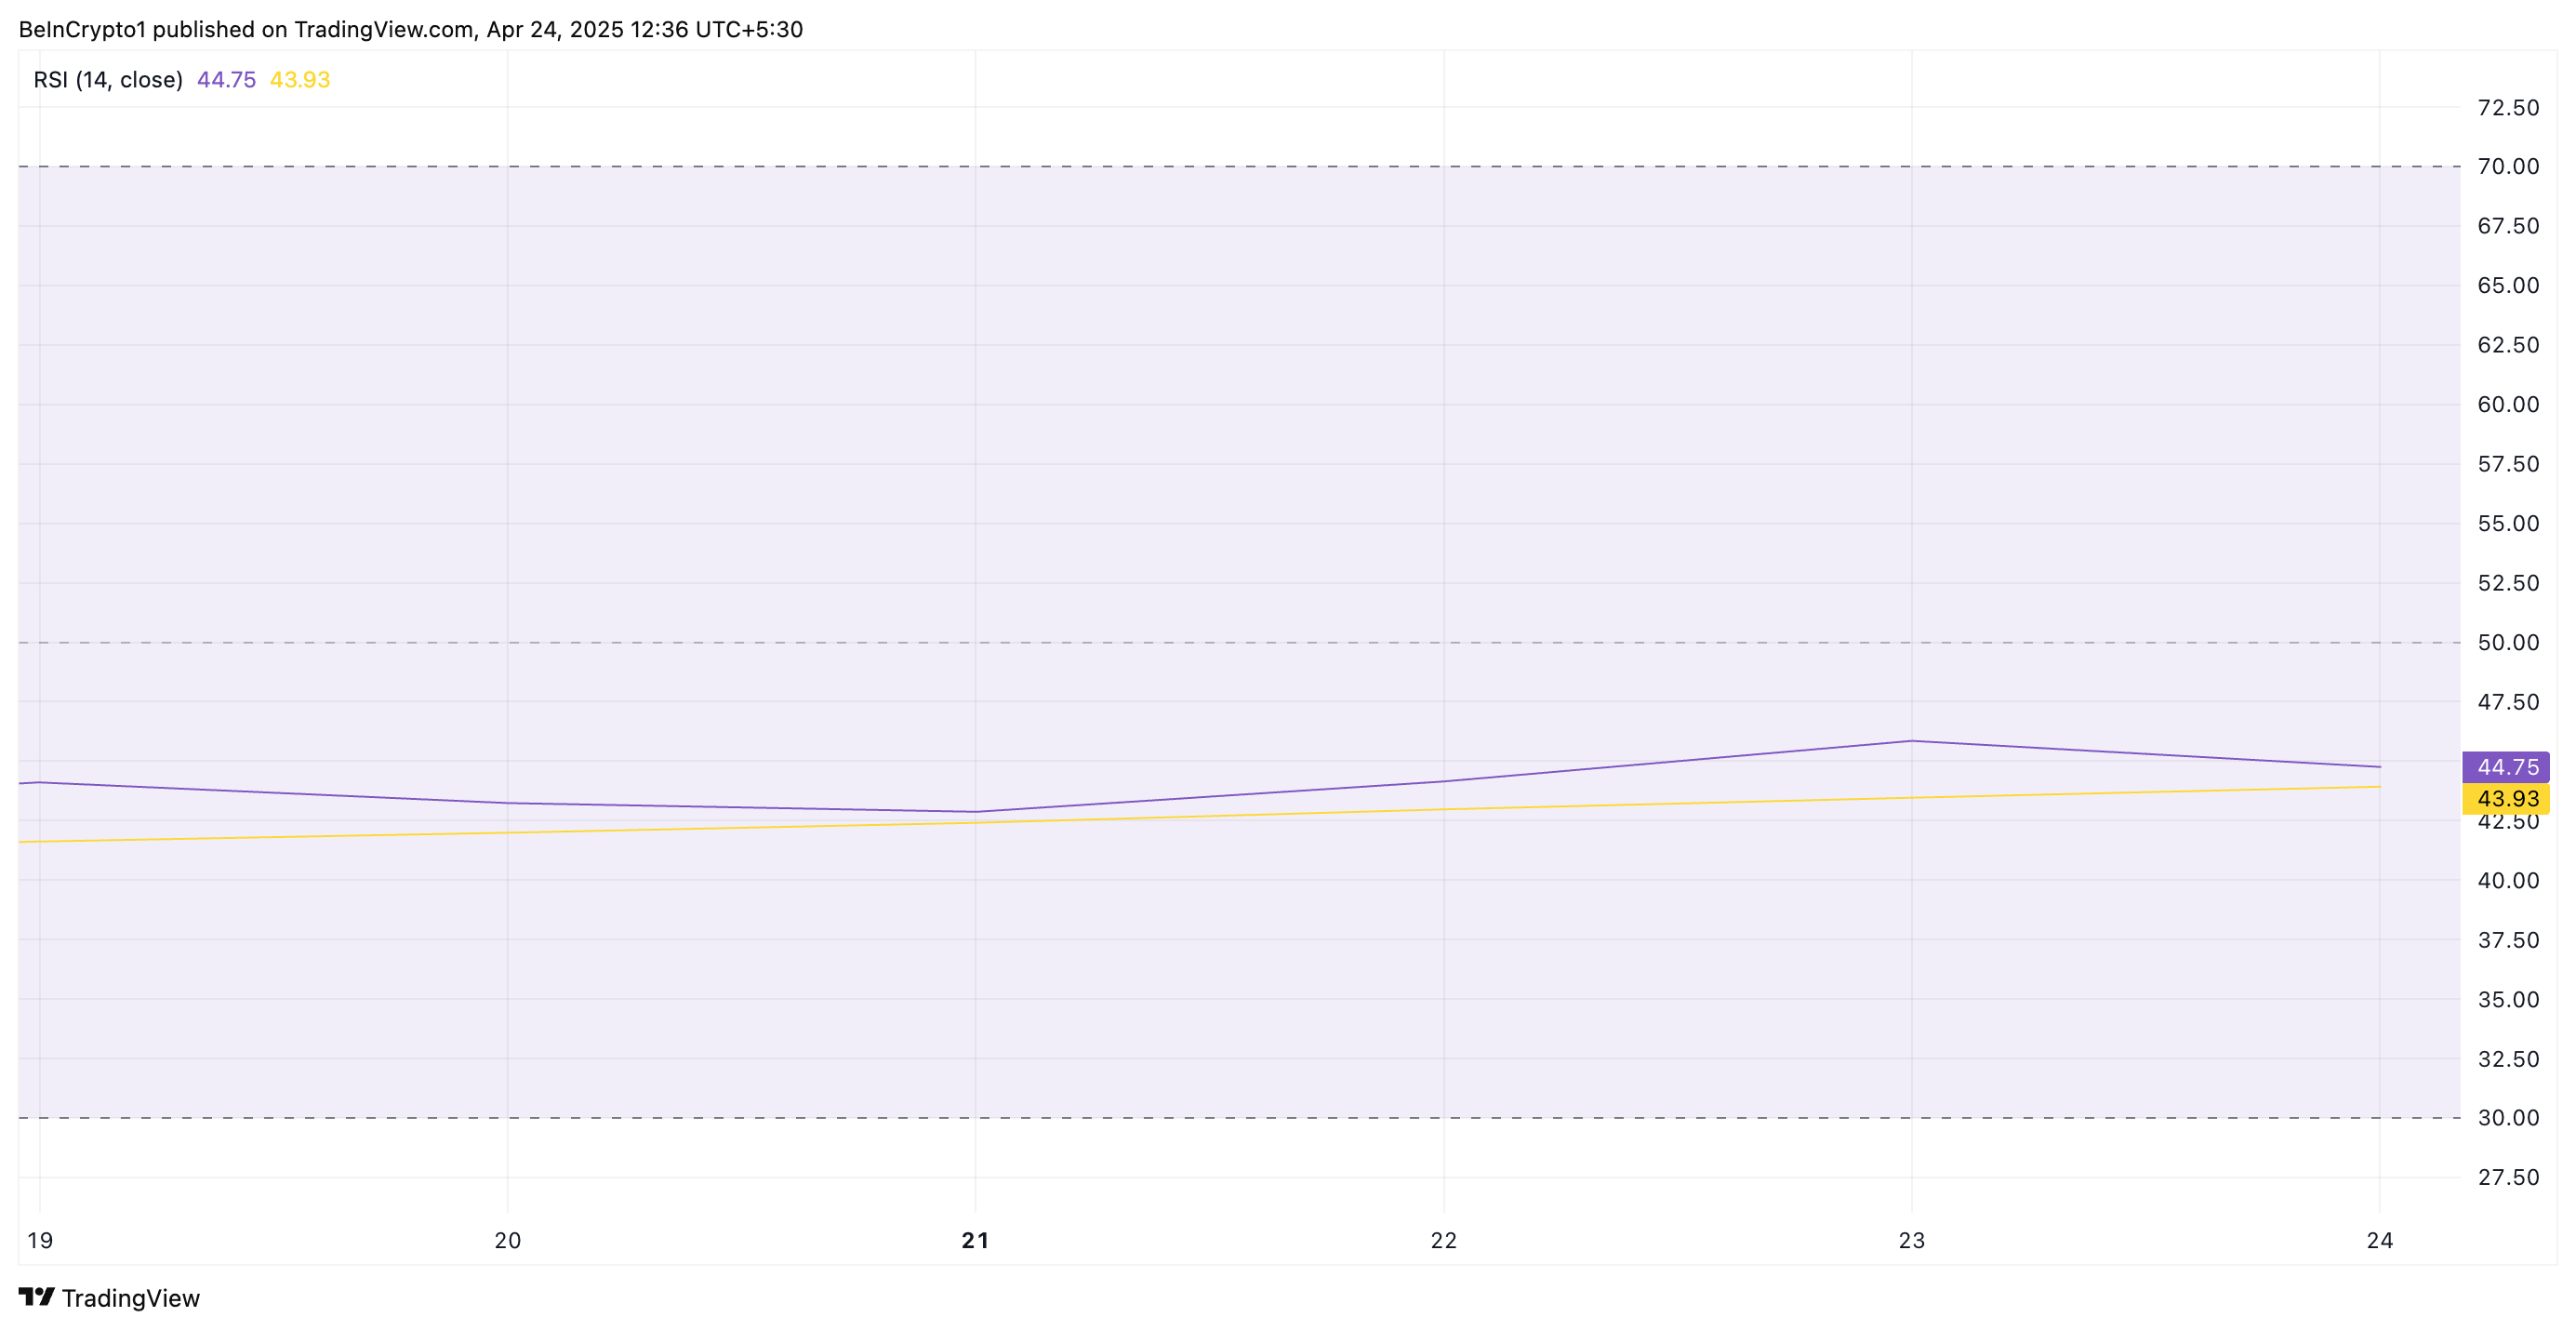
The RSI indicator measures an asset’s overbought and oversold market conditions. It ranges between 0 and 100. Values above 70 suggest that the asset is overbought and due for a price decline, while values under 30 indicate that the asset is oversold and may witness a rebound.
When it is flat like this, there is a balance between buying and selling pressure, with no clear momentum in either direction. This signals market indecision or consolidation, rather than a strong trend, despite PI’s price hike.
Further, PI’s Super Trend indicator, which continues to act as dynamic resistance above the token’s price, adds to the cautious outlook. This is currently at $0.85
The indicator helps traders identify the market’s direction by placing a line above or below the price chart based on the asset’s volatility.
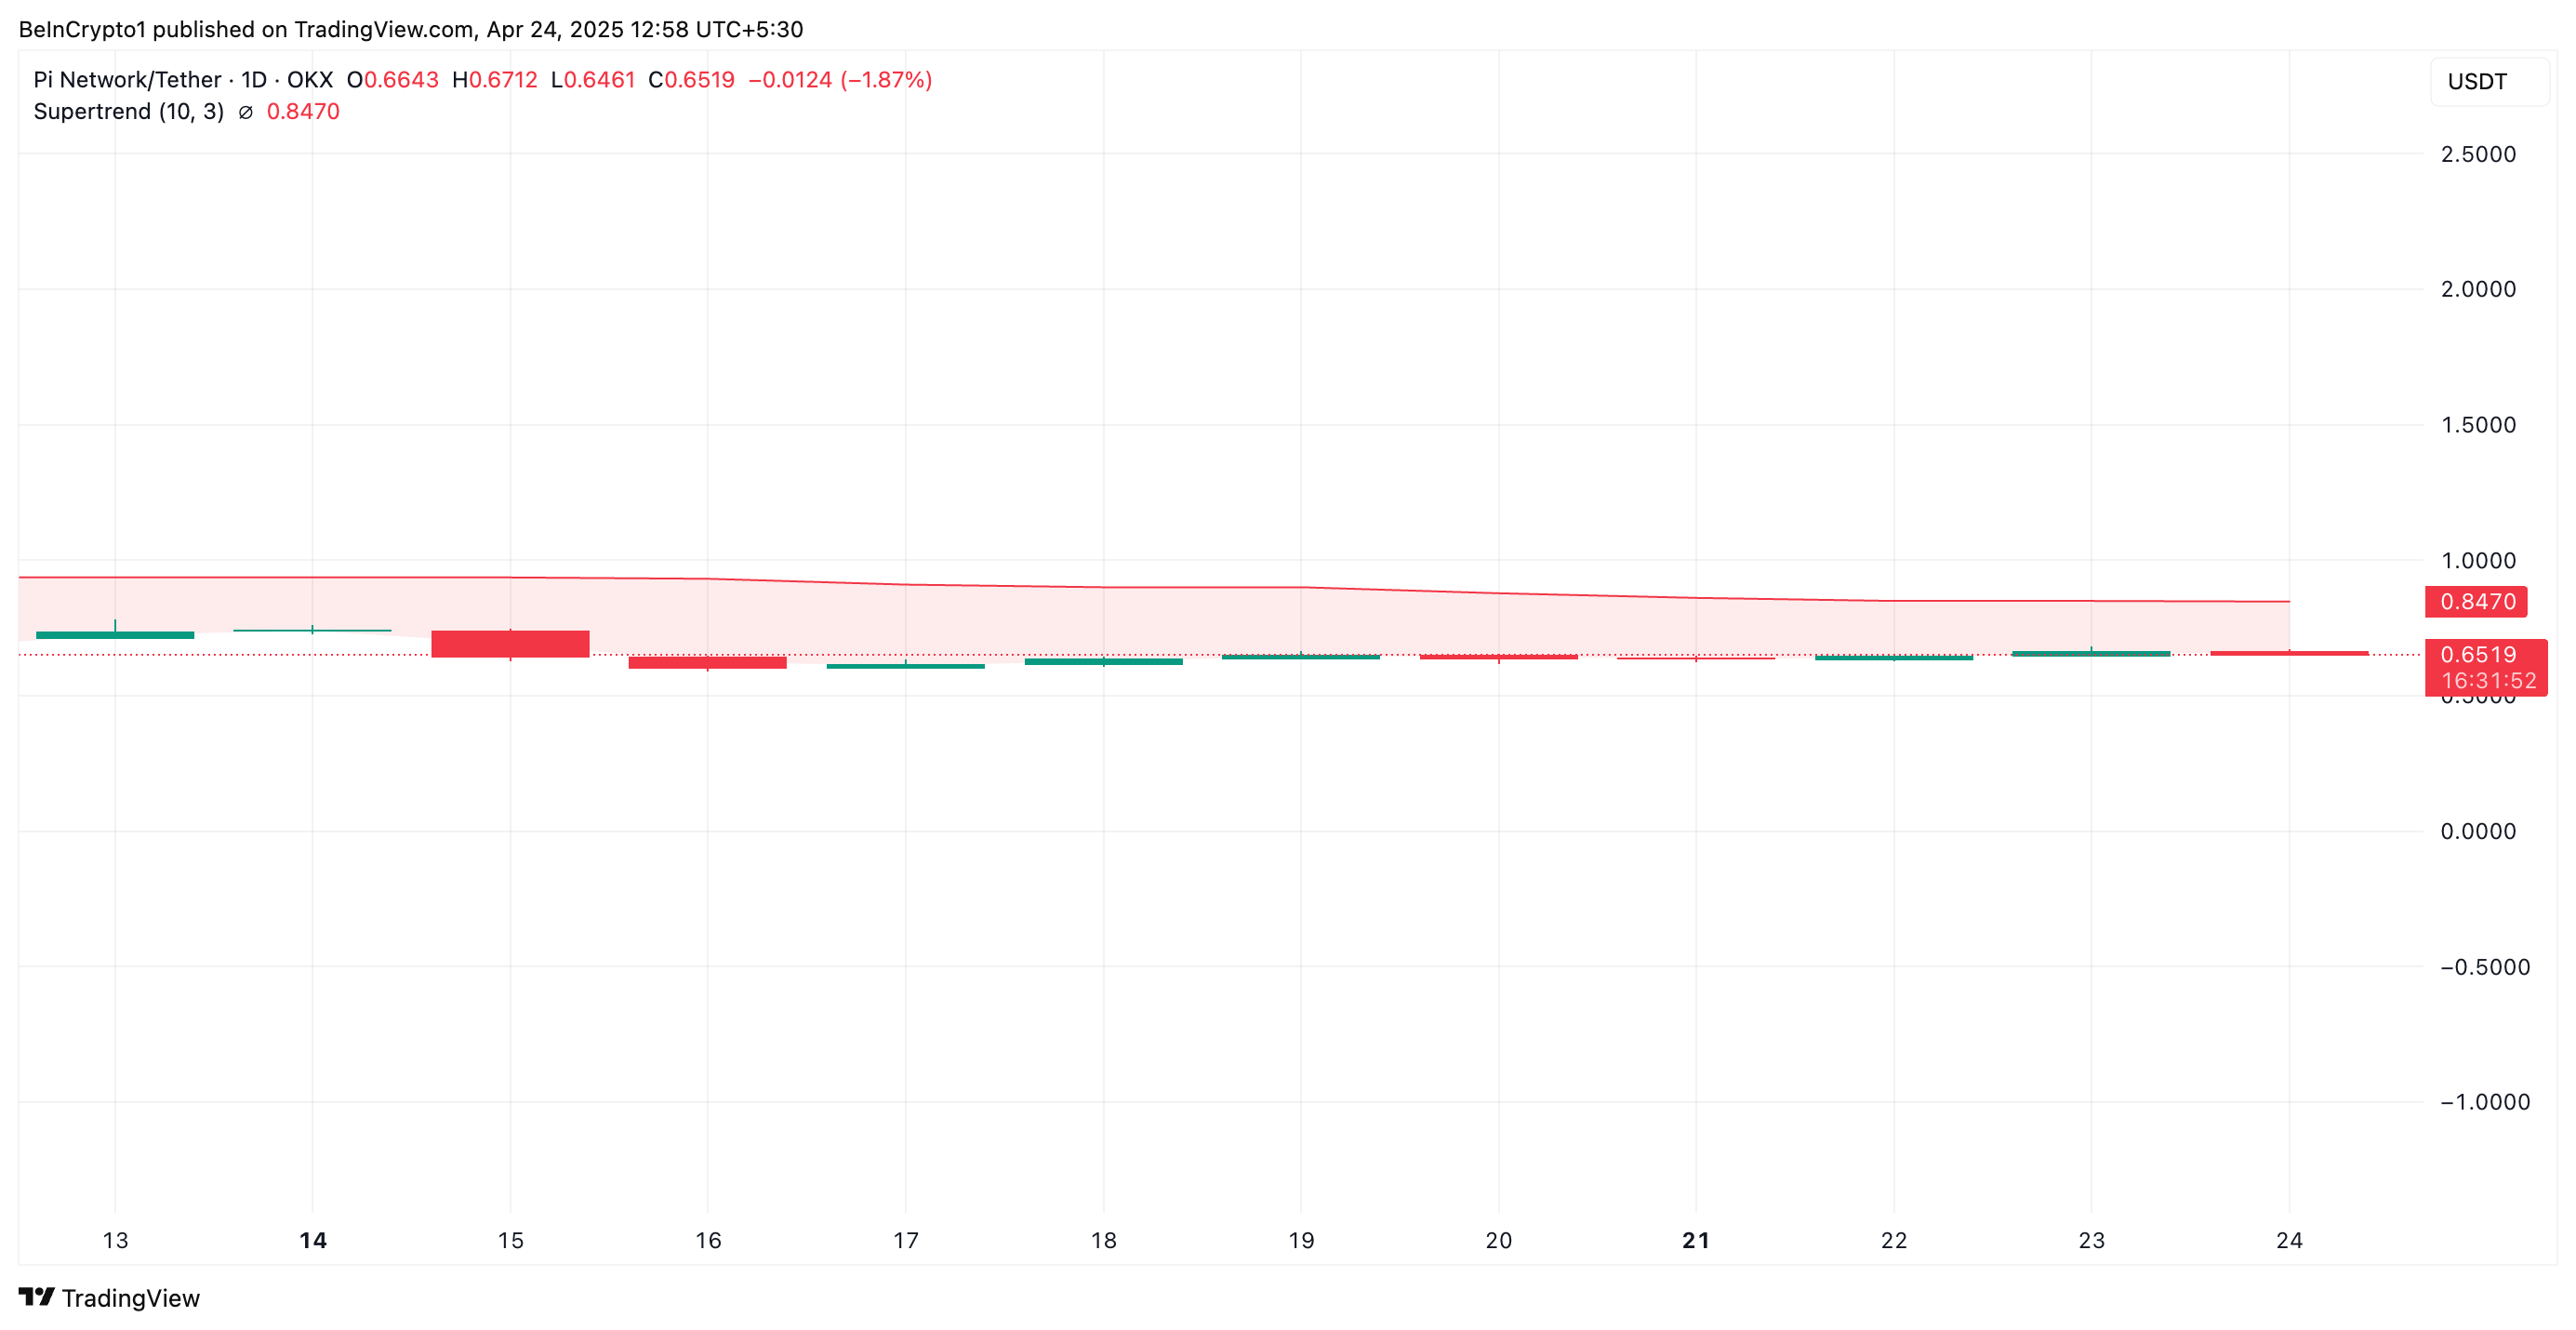
As with PI, when an asset’s price trades below the Super Trend line, it signals a bearish trend, indicating that the market is in a downtrend and selling pressure is dominant.
As PI struggles to break above this level, the trend line reinforces bearish sentiment and suggests pushing the asset higher in the short term will be difficult.
PI Risks Drop to $0.40 Without Renewed Demand
PI currently trades at $0.65, resting below its 20-day exponential moving average (EMA). This indicator measures an asset’s average price over the past 20 trading days, giving more weight to recent prices.
When the EMA is positioned above the asset’s current price, it signals a short-term downtrend, indicating that recent prices are lower than the average of the past 20 days. If demand wanes further, PI could extend its losses and revisit its all-time low of $0.40.
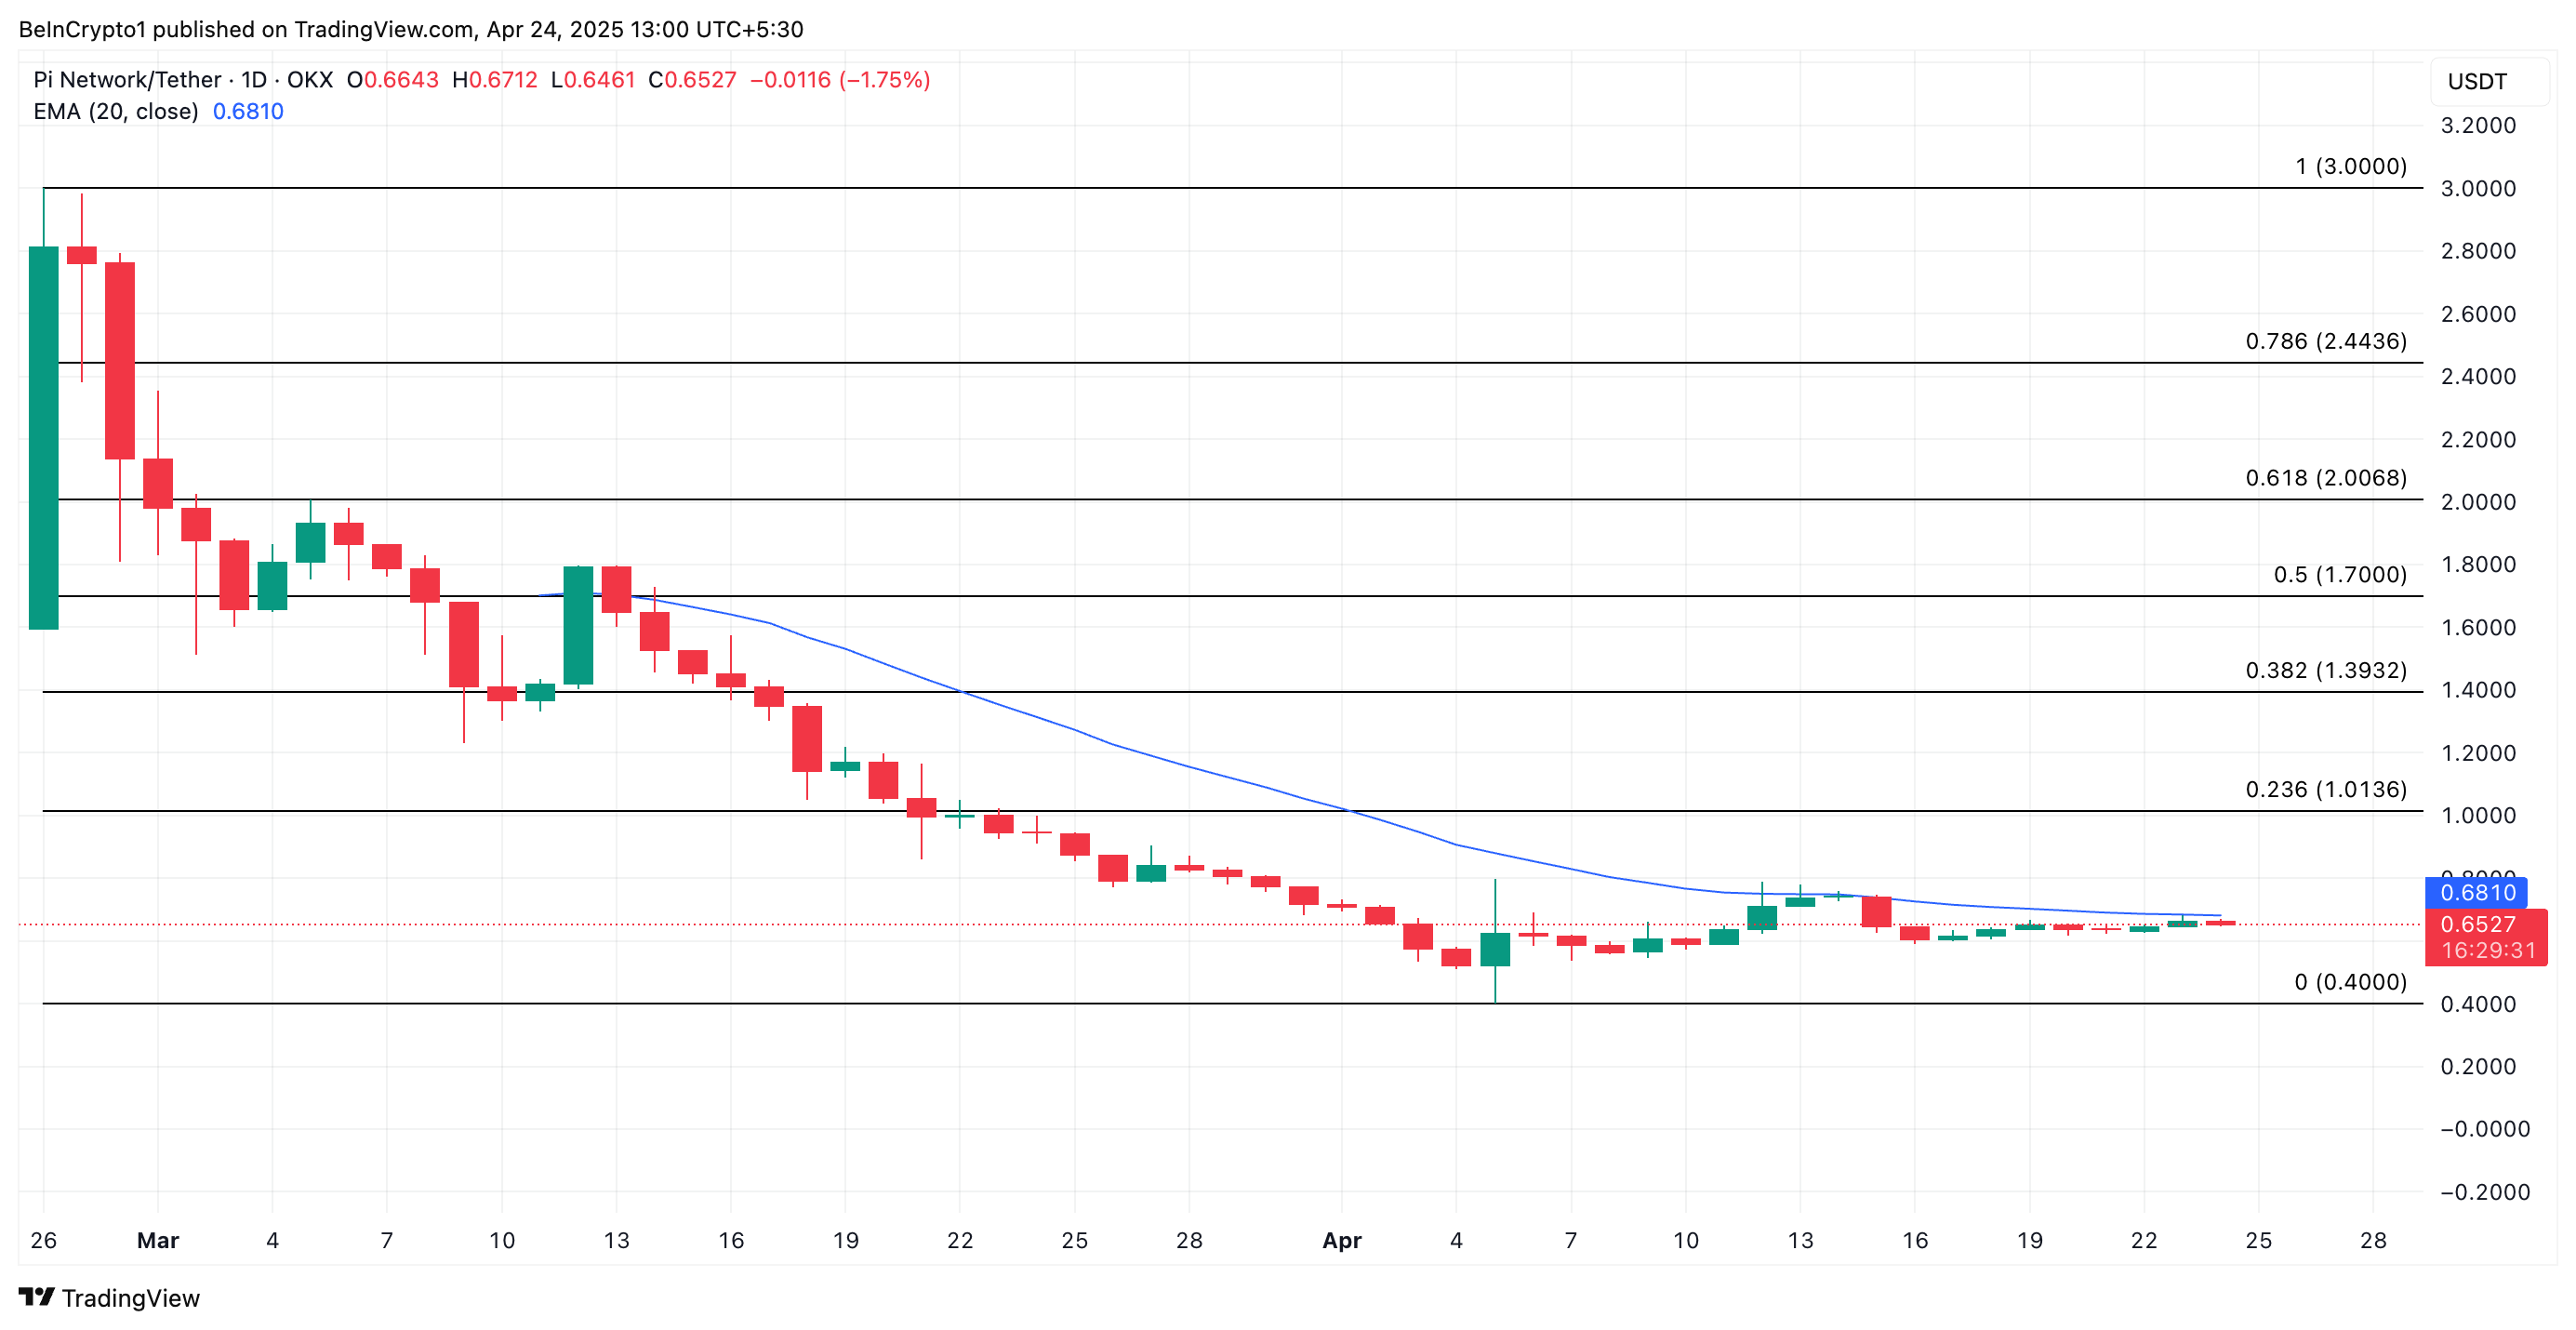
On the other hand, if the bulls regain market dominance, they could drive PI’s value above its 20-day EMA and toward $1.01.
Disclaimer: The content of this article solely reflects the author's opinion and does not represent the platform in any capacity. This article is not intended to serve as a reference for making investment decisions.
You may also like
Senate majority leader fast-tracks GENIUS Act to regulate stablecoins
Share link:In this post: Senate majority leader John Thune took steps to fast-track the GENIUS Act. Bill Hagerty may release an updated version of the GENIUS Act soon. Arthur Wilmarth believes the bill is deeply flawed.
Canada’s new Prime Minister will meet Trump to revive trading relations
Share link:In this post: Prime Minister Mark Carney will meet Donald Trump in Washington to address trade tensions. Canada plans to counter US tariffs affecting its key industries like auto and steel. King Charles will open Canada’s new parliament in Ottawa on May 27.
Google gets September court date to begin fight for its ad tech business
Share link:In this post: Google will face a U.S. antitrust trial starting September 22, 2025. The DOJ wants the tech giant to remove its key advertising tools, specifically its publisher ad server and ad exchange tools. The DOJ is attempting to force a sale of the Chrome web browser.

Charles Hoskinson Teases AI Agents Will Testrun Ouroboros Leios