XRP Testing Key Support – Could This Pattern Prevent Further Decline?

Date: Wed, April 09, 2025 | 05:36 AM GMT
The cryptocurrency market has witnessed another sharp fall in the past 24 hours due to renewed tariff tensions triggered by former President Donald Trump. As a result, Bitcoin (BTC) and Ethereum (ETH) are down by 3% and 8%, respectively.
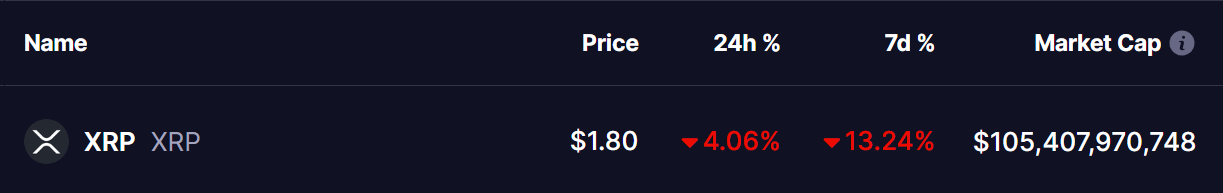
Among the altcoins , XRP also took a hit — declining by over 4% in the last day and extending its weekly drop to around 143. This decline has brought XRP to a critical technical point: it’s now testing a key support level that may determine its short-term future.
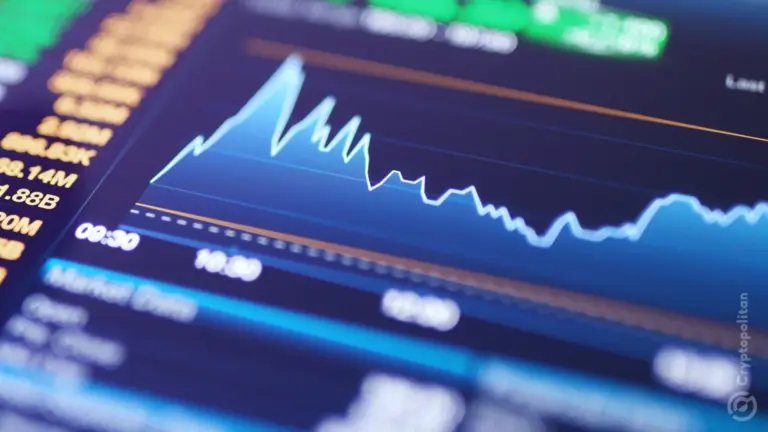
 Source: Coinmarketcap
Testing Support of Symmetrical Expanding Triangle Pattern
On the daily chart, XRP appears to be forming a symmetrical expanding triangle, a pattern that can lead to either a breakout or breakdown, depending on how price action behaves around key levels. XRP tested the lower boundary of this triangle around $1.61 on Monday and has been hovering just above that level since.
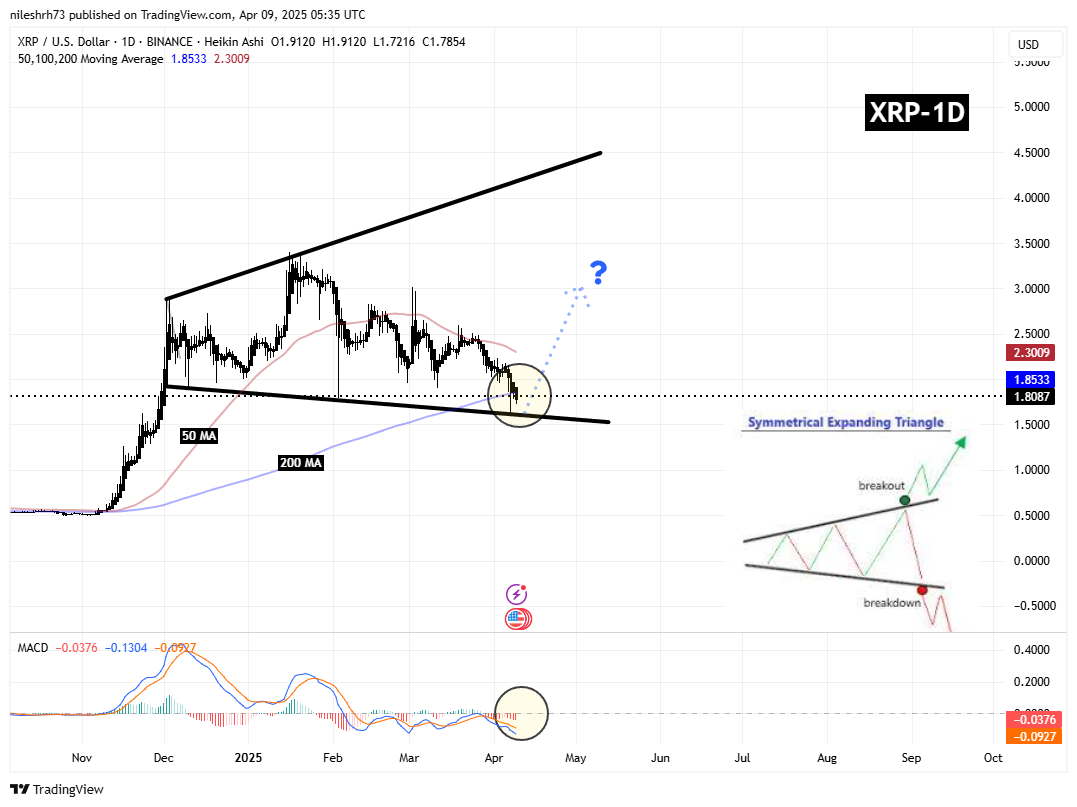 XRP Daily Chart/Coinsprobe (Source: Tradingview)
This area also overlaps with major support from the 200-day moving average (200 MA) and is not far from the 50-day MA — creating a confluence zone. If XRP manages to bounce from this point and break back above the $1.85 – $2.30 range (where the moving averages lie), it could signal a bullish reversal. That scenario may even open the door to a rally toward the $3.00 resistance.
On the flip side, failure to hold the lower trendline of the triangle could lead to further downside. A breakdown from this formation might push XRP into deeper territory, potentially revisiting earlier support zones around $1.30 or lower, which could spook investors and trigger stop-loss cascades.
What’s Next?
All eyes are now on how XRP behaves in the coming days. Will it defend this crucial support and reverse, or will the expanding triangle break down under pressure? With macroeconomic tensions still looming and market volatility high, traders should proceed cautiously.
Key Support: $1.61
Resistance to Watch: $1.85 (200MA), $2.30 (50MA)
Bullish Confirmation: Break above 200 MA
Bearish Risk: Drop below expanding triangle support
Disclaimer: This article is for informational purposes only and not financial advice. Always conduct your own research before investing in cryptocurrencies.
Disclaimer: The content of this article solely reflects the author's opinion and does not represent the platform in any capacity. This article is not intended to serve as a reference for making investment decisions.
You may also like
Long-term BTC holders are back in accumulation mode
Share link:In this post: The period of capitulation and spot selling has ended, and almost all wallet cohorts either hold or accumulate. 87.6% of the BTC supply is in profit, as the coin consolidates around $97,000. Short term buyers are in the money, feeling less pressure for wallets aged less than one month.
US stocks surge as jobs data eases recession fears, S&P 500 eyes 20-year win streak
Share link:In this post: The S&P 500 jumped 1.5% on Friday, heading for its longest winning streak since 2004. April payrolls beat expectations with 177,000 jobs added, easing recession fears. Apple dropped 3% after missing revenue targets, while Amazon rose slightly.
Three Key Scenarios for Bitcoin Price in 2025 – Could BTC Hit $175,000?

Hedera (HBAR) Struggles to Build Bullish Pattern in Tight Range